Filtering a Visual
Post-query Filters are available in Visuals, the same as on a Dataset. If saved post-query Filters exist in a Dataset, they are also available for use in Visuals. They work the same way as Filters on a Dataset: the filtered results are generated dynamically without running the Query again.
Adding Filters to a Visual
To filter a Visual, go to the Dataset listing page, open the Dataset that contains the Visual, and click the pie chart (Visuals) icon in the left panel.
Select the Visual to filter with the View button in the Visuals list. Then click the + next to Filter to open the Column Chooser.
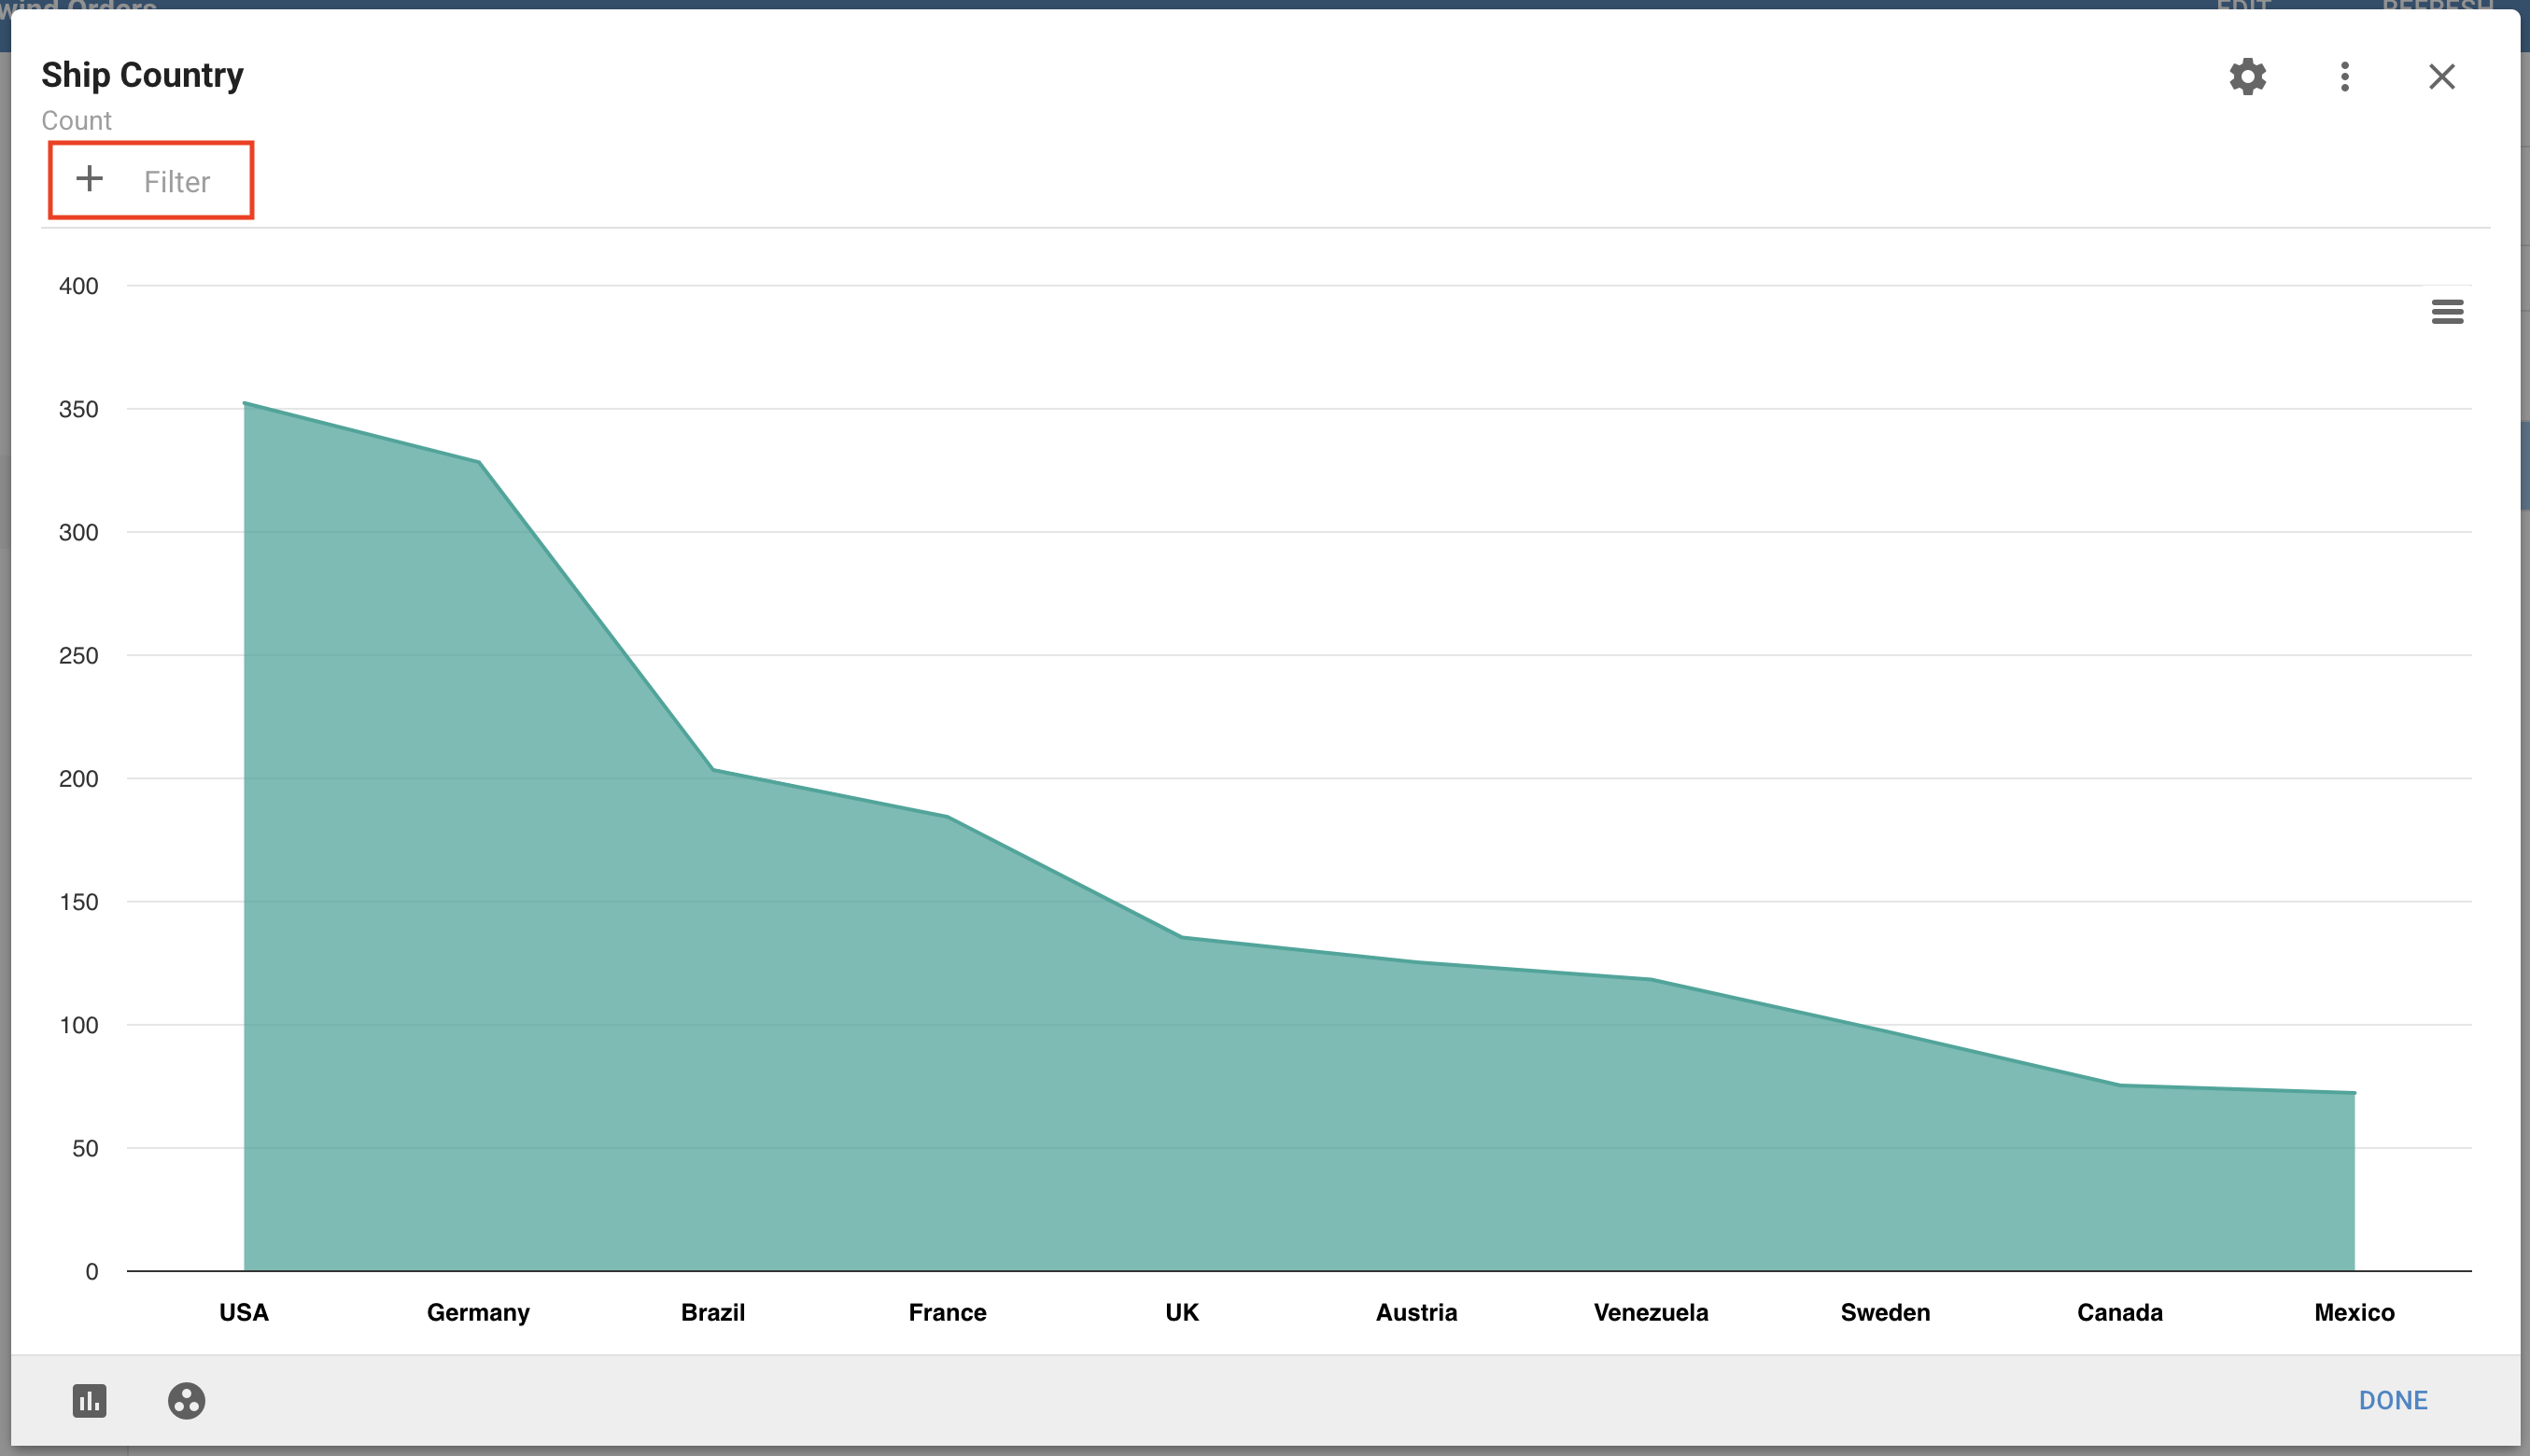
Choose the Field to filter by, or choose a Saved Filter. Fields are displayed by data type to help you locate them in large Datasets, and you can use the search to find columns.
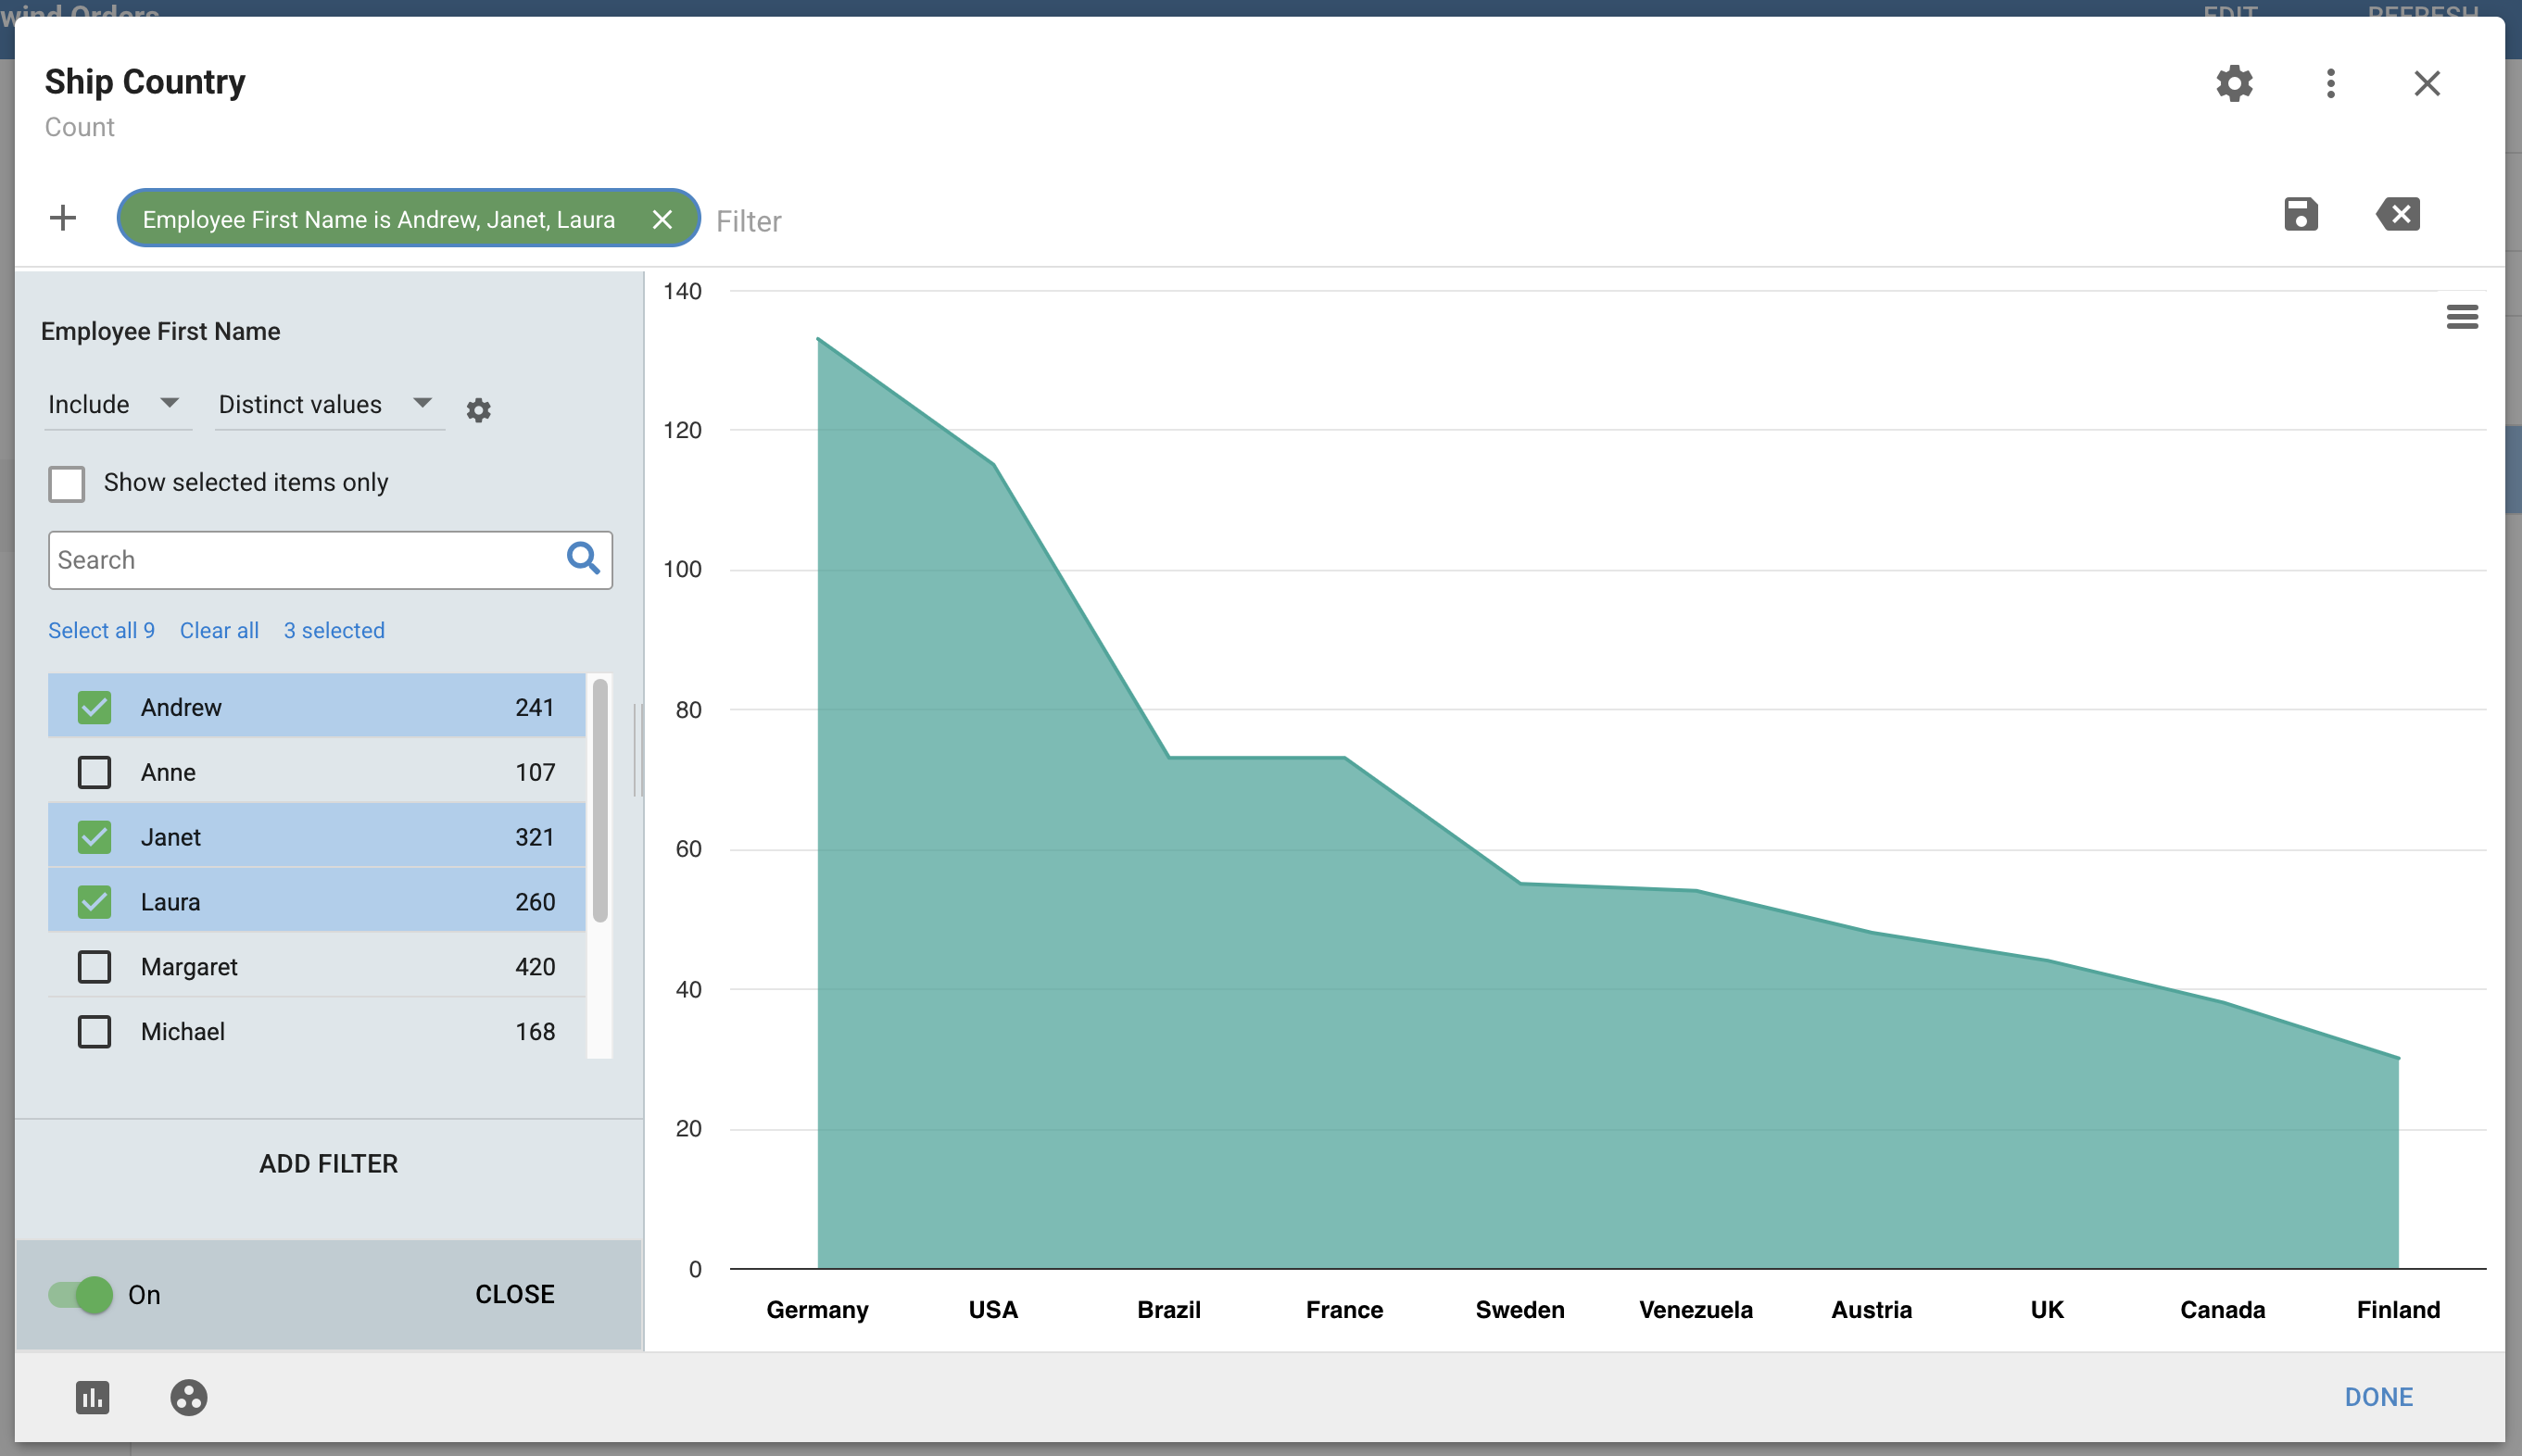
To create Filter Chips, choose a Field and set the parameters. Include or exclude the values and choose the expression to query the data. Add more Filters by clicking the + in the Filter Bar or choosing Add Filter below the list of values.
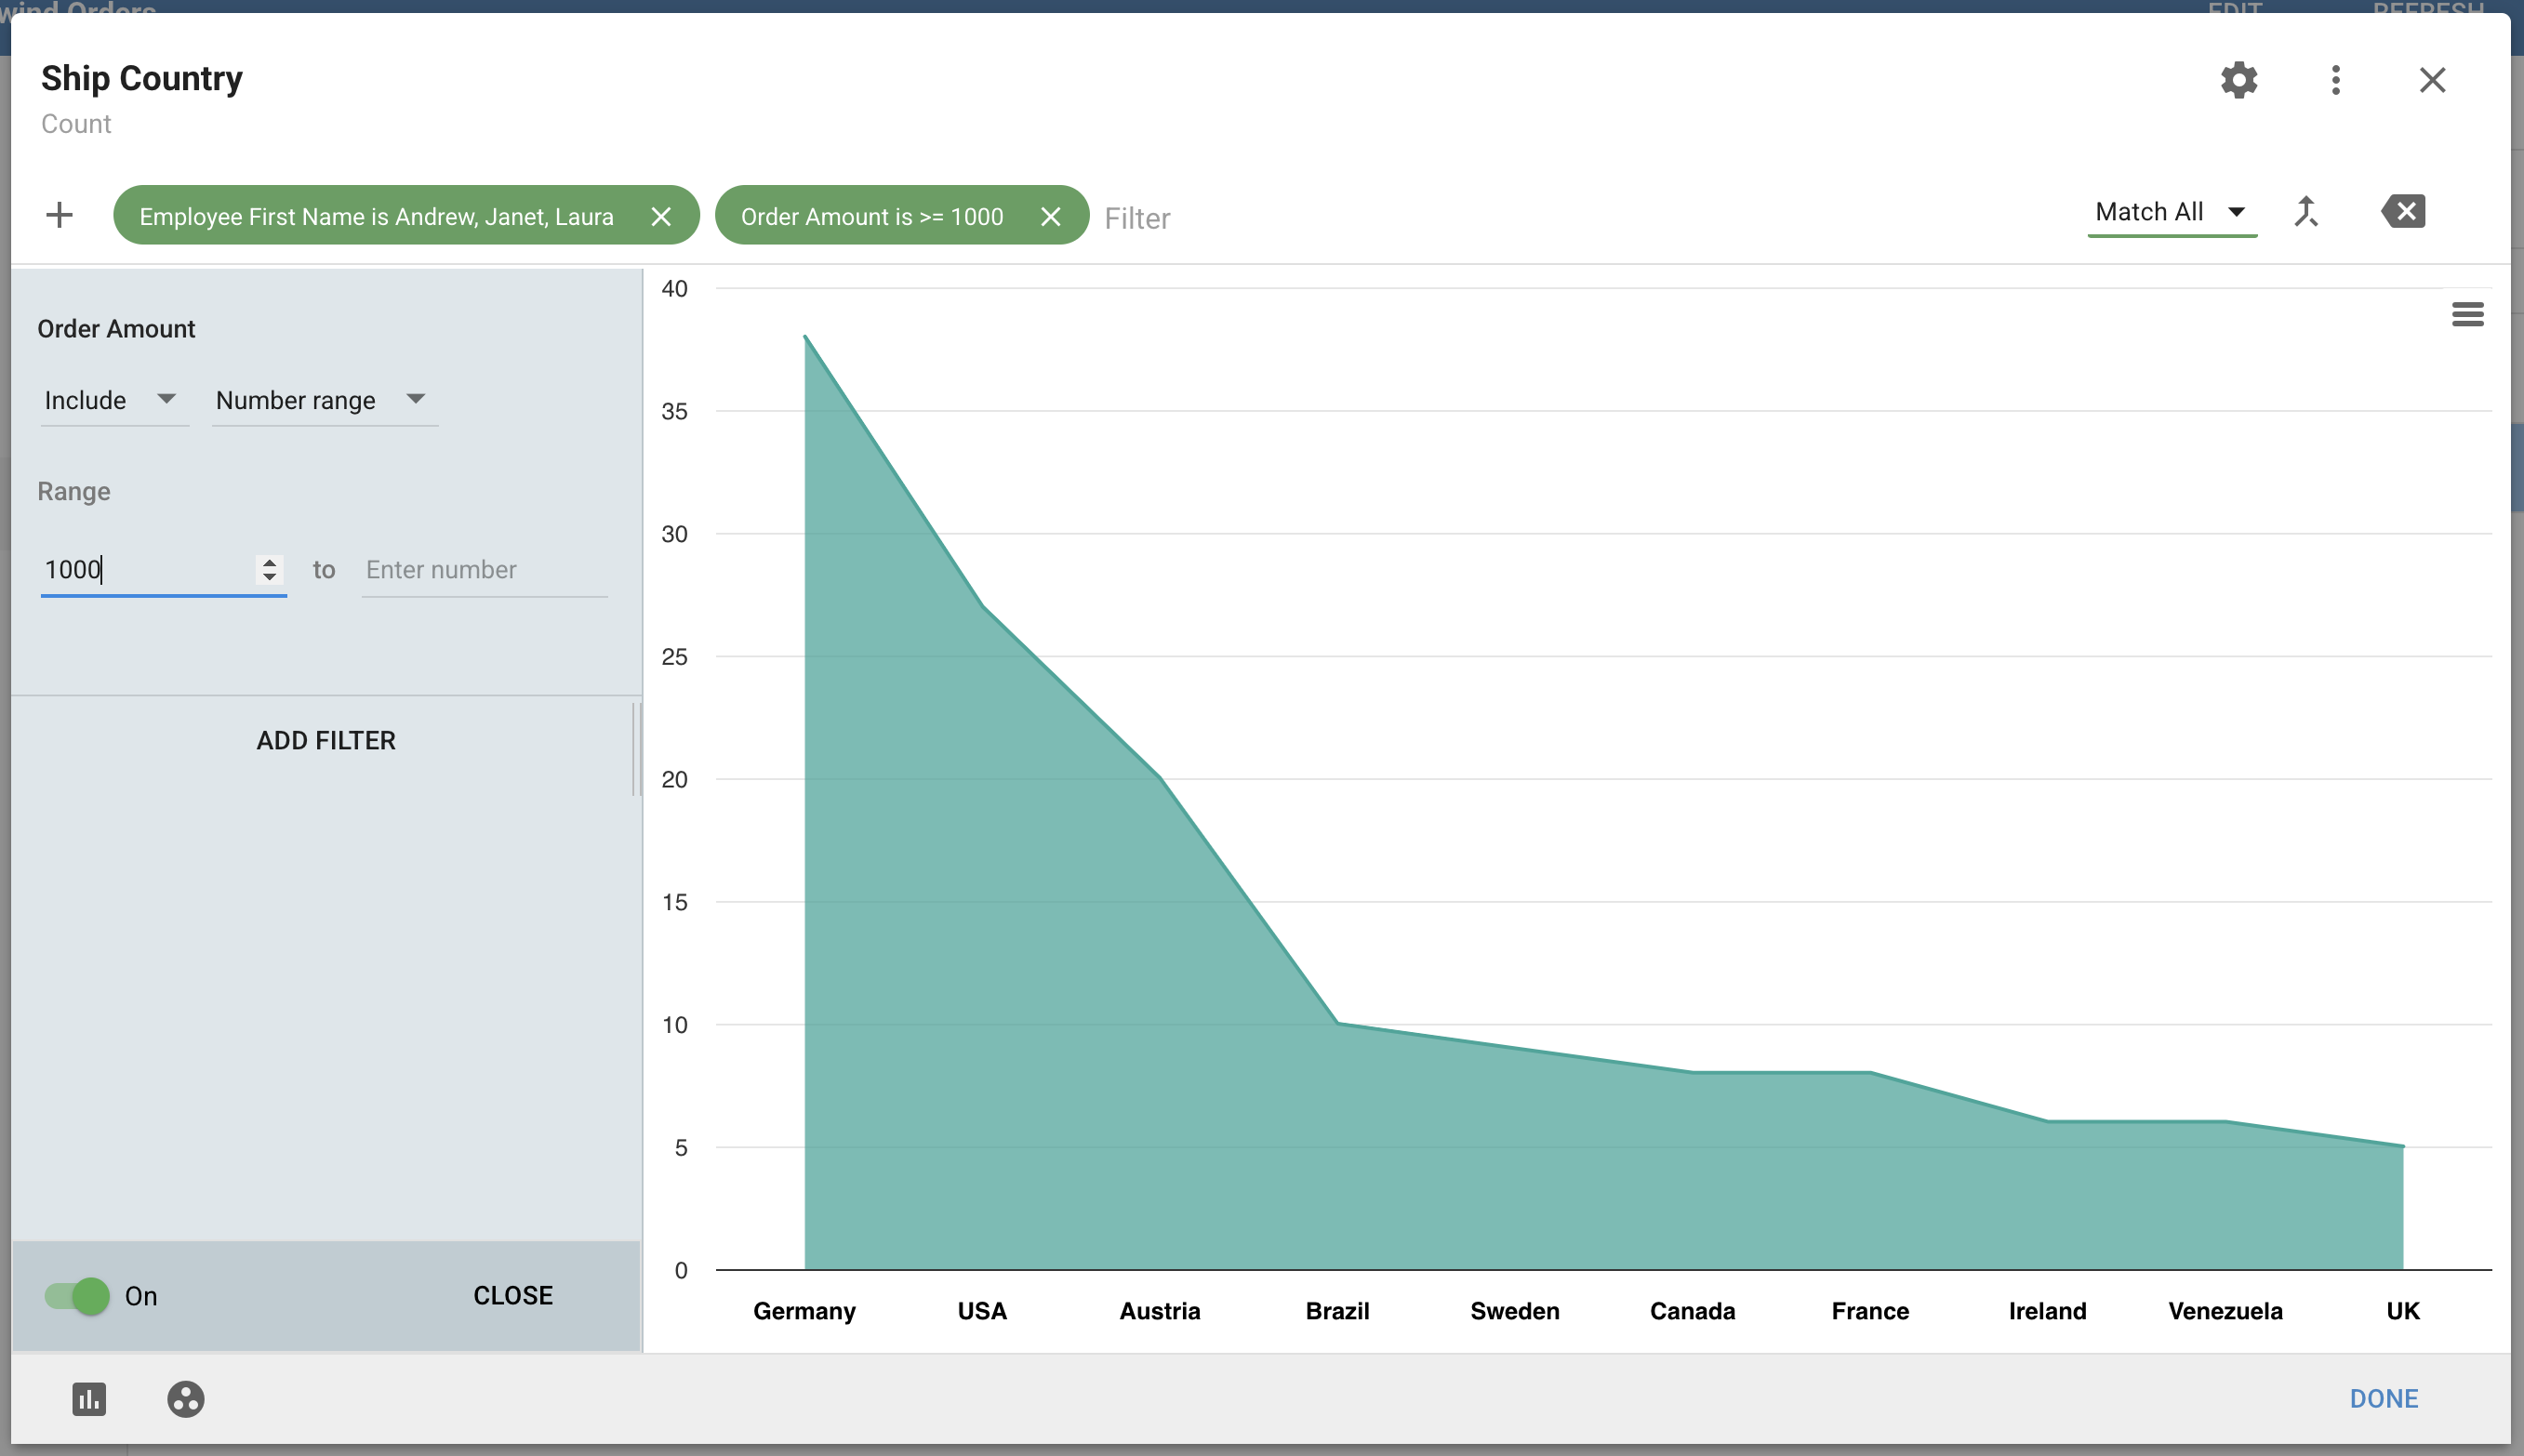
To narrow the data further, continue adding Filter Chips. You can save or merge Filters (see Saving and managing Filters). Click Done in the bottom-right corner to apply the Filters to the Visual.
To use a Saved Filter on different Visuals of the same Dataset, click the + icon and select the Filter under Saved Filters. Change a Saved Filter's access to let Users other than the owner apply it to Visuals.
Removing Filters from a Visual
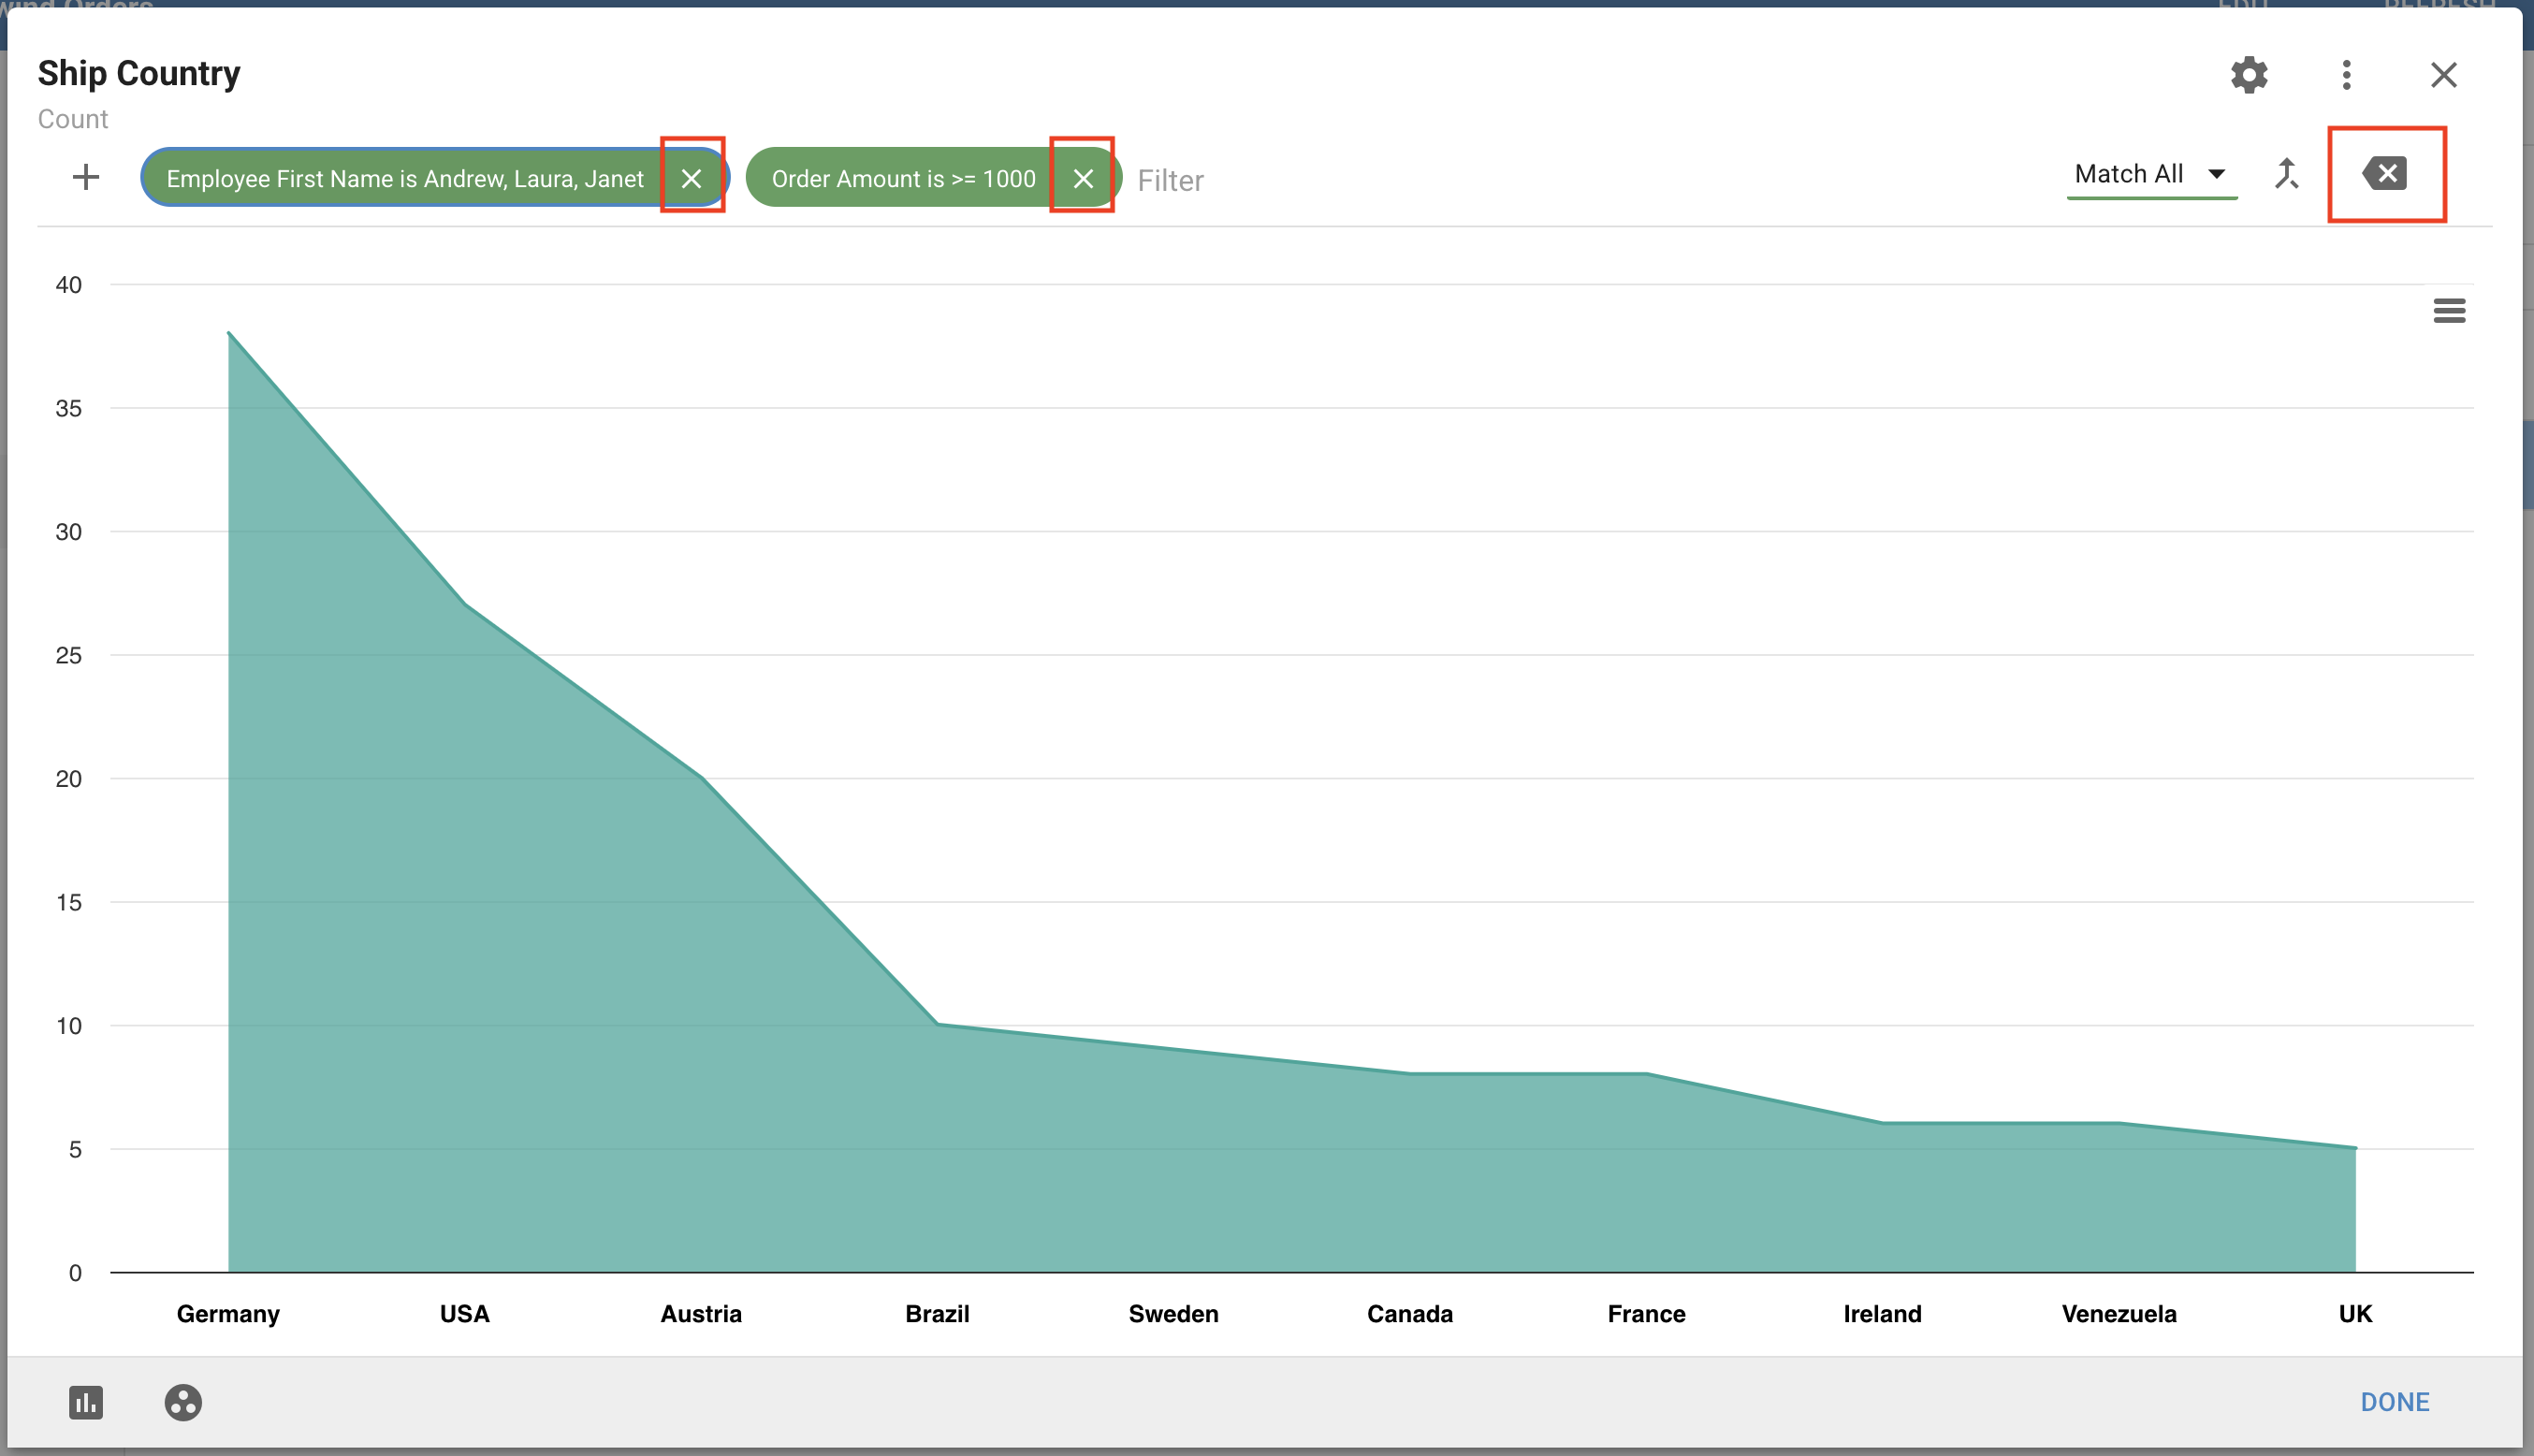
To remove all Filters from a Visual, click the X in the upper-right corner of the dialog. To remove only certain Filters, click the X inside the Filter Chip. After removing Filters, click Done to save the changes.