Configuring a Visual
Configure a Visual by opening the Dataset that contains it on the Dataset listing page and clicking the pie chart (Visuals) icon in the left panel.
A list of all Visuals associated with the Dataset displays.
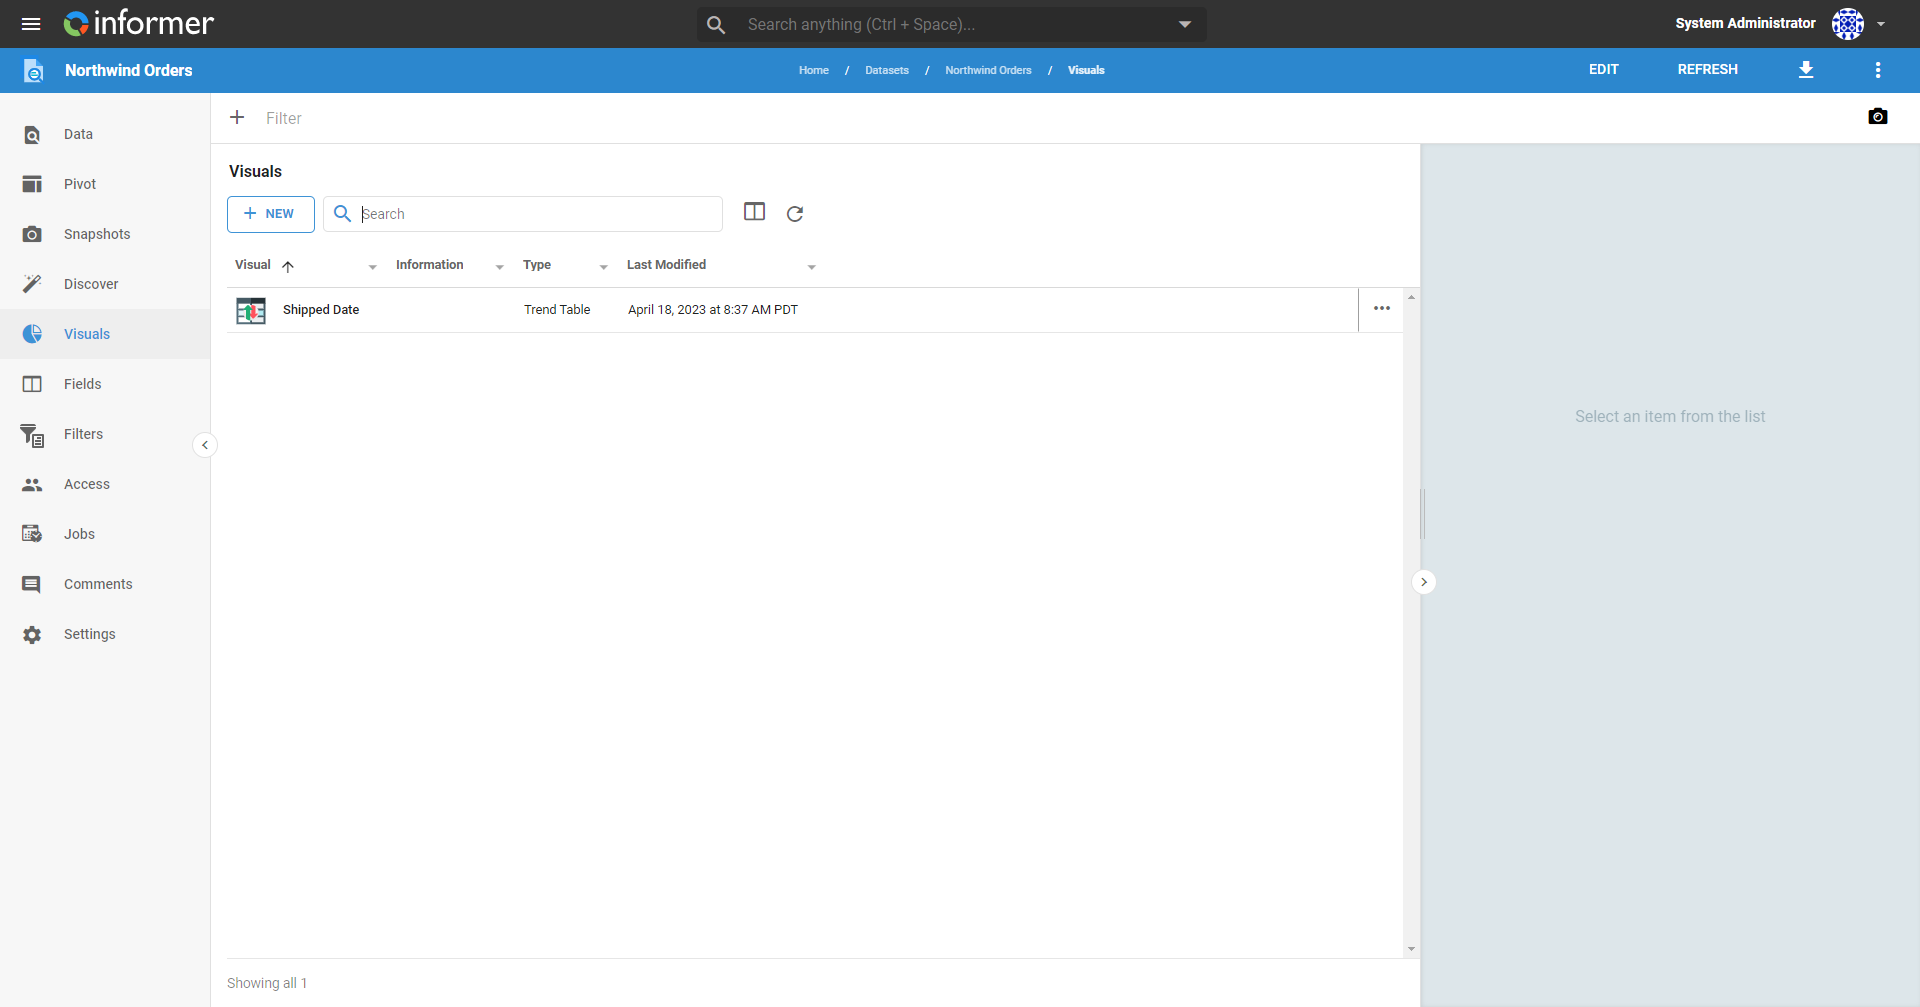
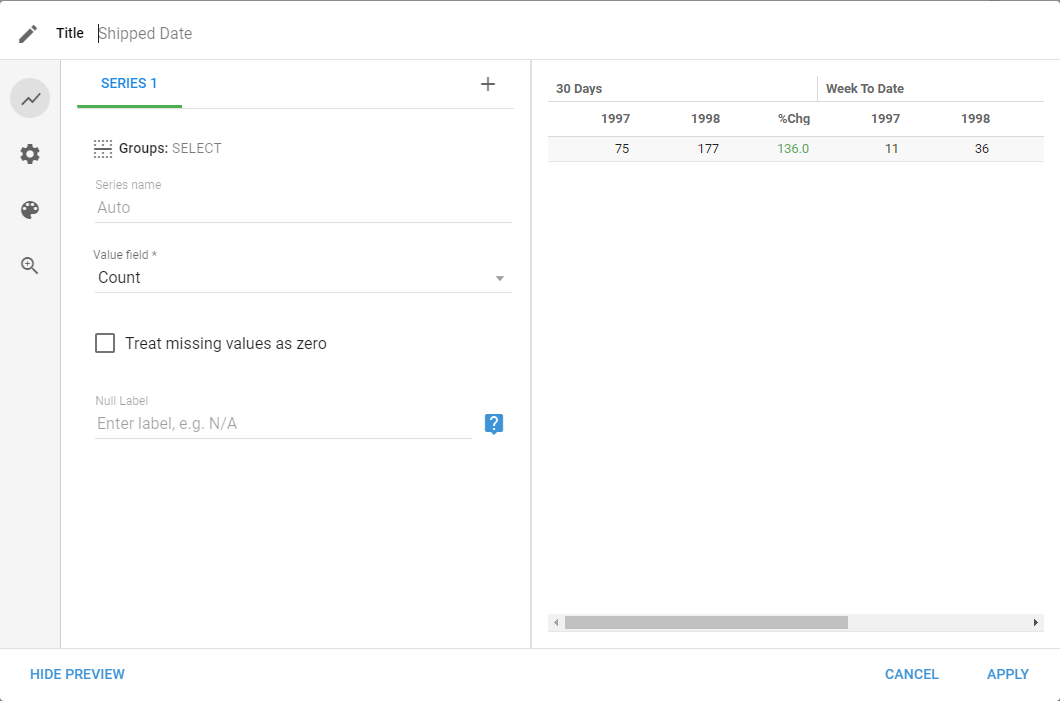
Click the ... to the right of the Visual and choose Configure to open the configuration window. This window has options in the left panel that depend on the type of Visual. For the configuration options of each kind of Visual, see Types of Visuals.
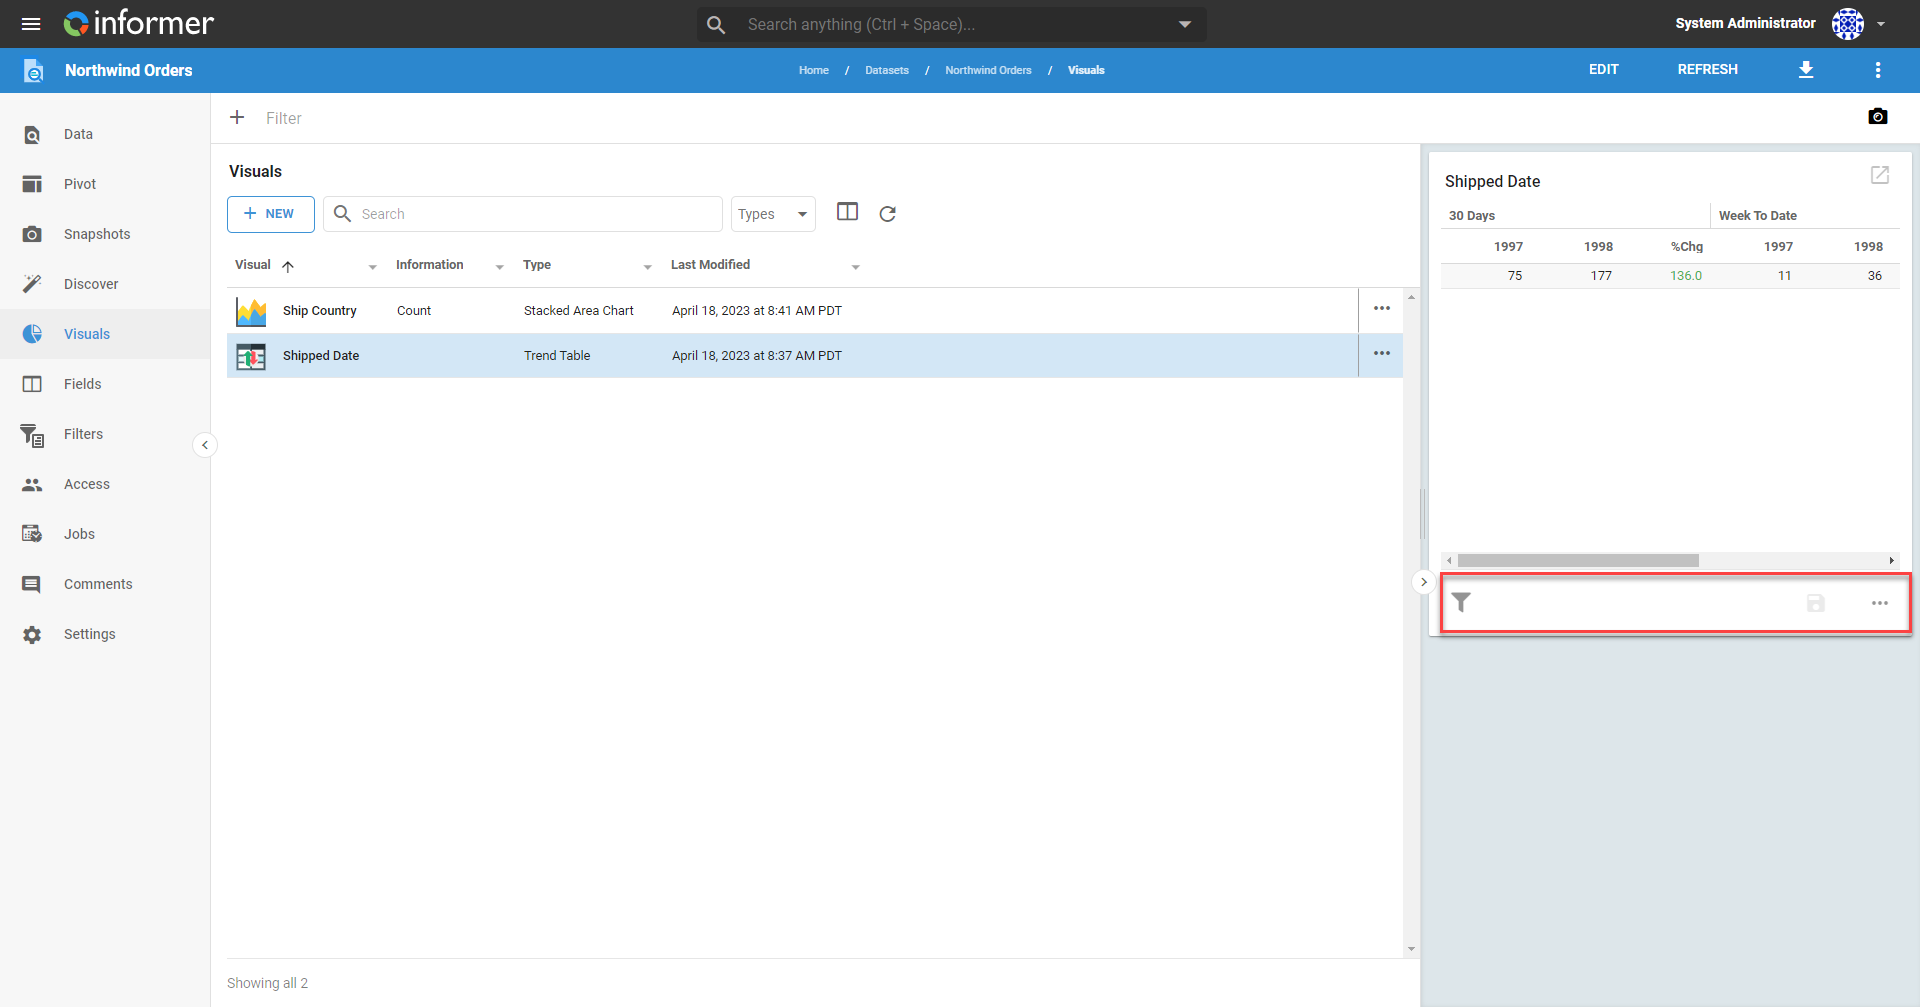
Many Visuals also have icons in the bottom-left corner of the Visual preview to quickly configure values as needed.
Also available through the REST API
Everything on this page is built on Informer's public REST API, the same one the product uses, so your scripts and integrations can do it too. Developer reference: Datasets.