Working with Reports
A Report turns the data in your DatasetA saved, queryable collection of data pulled from one or more Datasources. Datasets are the foundation for reports, dashboards, and AI data analysis.s into something people can read, share, and act on: an interactive dashboard of charts and tables, a quick Ad Hoc QueryA saved, parameterized query in Informer. Together with Datasets, Ad Hoc Queries are the data foundation Magic Reports build on. for exploring a Datasource, or a pixel-perfect document like an invoice or a letter.
Why Reports matter
A DatasetA saved, queryable collection of data pulled from one or more Datasources. Datasets are the foundation for reports, dashboards, and AI data analysis. holds the data; a Report is how you present it. The same Dataset can back a live dashboard for a manager, a side-by-side comparison for an analyst, and a formatted statement for a customer, each one a different Report reading from the same indexed records. Building the presentation as a Report (rather than re-querying every time) means it refreshes with the data, respects who is allowed to see which Fields, and can be shared, scheduled, and exported.
The kinds of Report
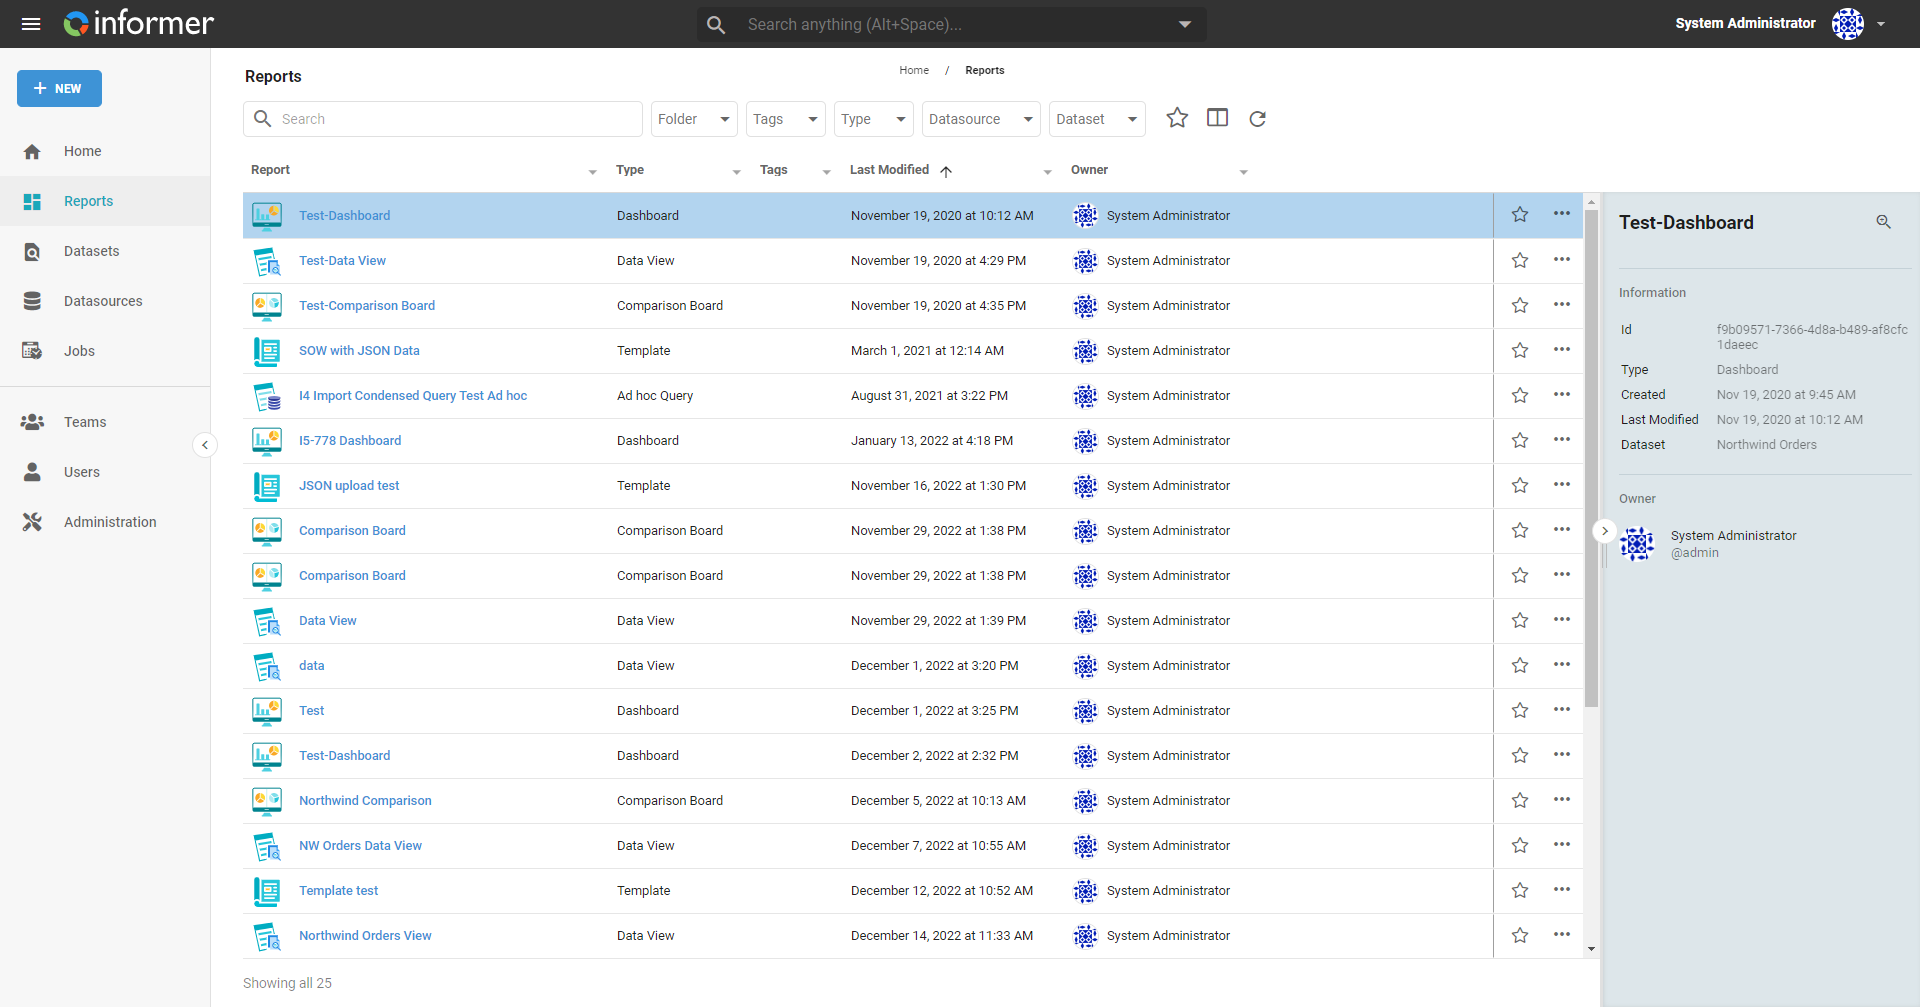
The New menu groups Reports into three families, depending on what you want to produce:
| Family | Report type | What it produces |
|---|---|---|
| Interactive | Dashboard | A layout of DatasetA saved, queryable collection of data pulled from one or more Datasources. Datasets are the foundation for reports, dashboards, and AI data analysis.-backed Visuals (charts, tables, KPIs) you can move, resize, configure, and filter together. |
| Interactive | Comparison Board | Visuals compared side by side, split by the unique values of a Field. |
| Interactive | Data View | A customized view for reading and exploring the records of a single Dataset. |
| Ad Hoc Query | Native SQL | An Ad Hoc QueryA saved, parameterized query in Informer. Together with Datasets, Ad Hoc Queries are the data foundation Magic Reports build on. whose exact statement you write yourself and send straight to the database. |
| Ad Hoc Query | Query Designer | An Ad Hoc QueryA saved, parameterized query in Informer. Together with Datasets, Ad Hoc Queries are the data foundation Magic Reports build on. you build visually, without writing database code. |
| Pixel Perfect | Template | A highly formatted HTML document (invoices, letters, certificates), viewable in the browser or exported to PDF. |
A Magic ReportA simpler kind of App built on Datasets and Ad Hoc Queries. Magic Reports are available to every Informer tenant; full Apps (with server routes, databases, and messaging) require the Apps license. and full Apps are a separate, code-driven kind of Report; they are covered in the Apps section.
The Report workspace
Open a Report and you get a workspace with a tab for each thing you can do with it:
| Tab | What it's for |
|---|---|
| View | View and interact with the Report |
| Access | The owner and Teams that have access to this Report |
| Comments | Discussion regarding the Report |
| Settings | Configure the settings of the Report |
In this section
| Chapter | In one line |
|---|---|
| Overview | The listing page, the three families of Report, and the Actions menu. |
| Dashboards | Lay out Visuals on a canvas and let viewers filter them. |
| Visual Configurations | Configure each chart type: line, bar, pie, map, KPI, and more. |
| Comparison Boards | Compare segments of your data in side-by-side columns. |
| Data Views | A spreadsheet-style grid and pivot over a single Dataset. |
| Ad hoc Queries | Temporary, real-time Queries built with SQL or the Designer. |
| Templates | Pixel-perfect HTML/PDF output, with data injected via Nunjucks. |
| Access | Sharing, ownership, and the Team role breakdown. |
| Appendix | Custom aggregates, external links, and public Reports. |
Where do I look when...
| You want to... | Where |
|---|---|
| Build a new Report | Creating a Report |
| Lay out charts on one page | Dashboards |
| Configure a specific chart type | Visual Configurations |
| Compare Visuals side by side | Comparison Boards |
| Read and explore one Dataset's records | Data Views |
| Write the exact query yourself | a Native SQL Ad hoc Query |
| Produce a formatted invoice or letter | Templates |
| Share a Report outside Informer | External Links |
| Let viewers filter the Report's data | turn on Enable Report Filtering in the Settings tab |
| Control who can see the Report | the Access tab |