Creating a Report
From the + New button, select Report. There are three categories of Report available: Interactive, Ad hoc Query, and Pixel Perfect.
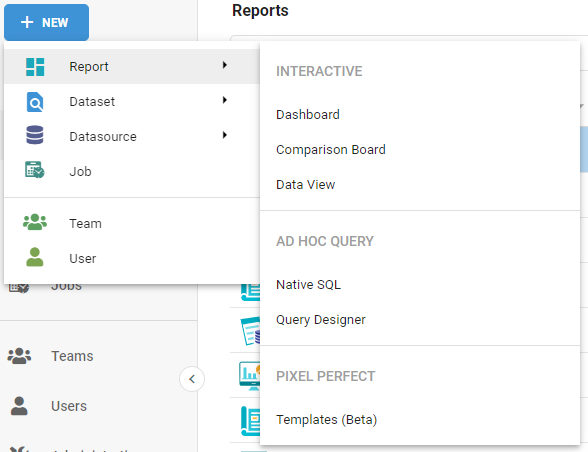
After selecting the type of Report, enter the required information and click Save to create the Report.
Interactive
Dashboard
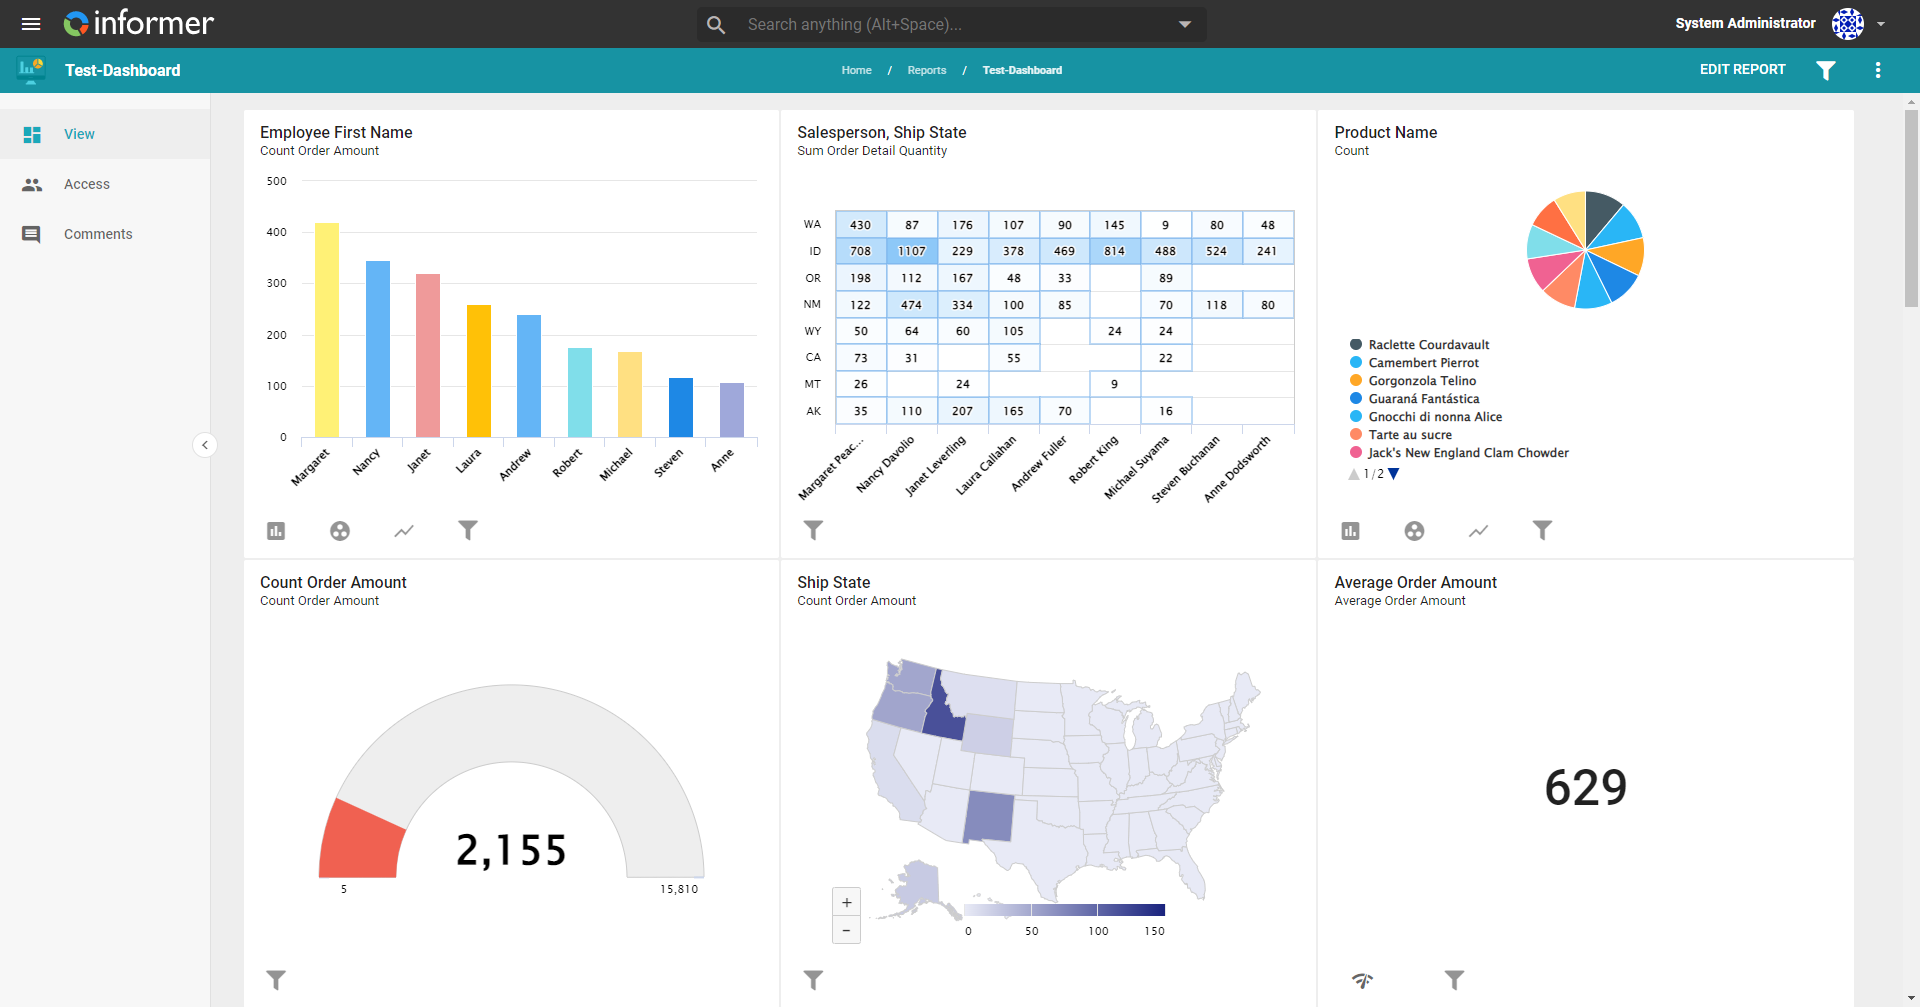
Dashboards are customizable layouts of Visuals that provide a quick overview of the data. Each Visual can be moved, resized, configured, and filtered separately from the others. To further customize the Dashboard, apply a global Filter to the Visuals if desired. For more, see the Dashboards chapter.
Comparison Board
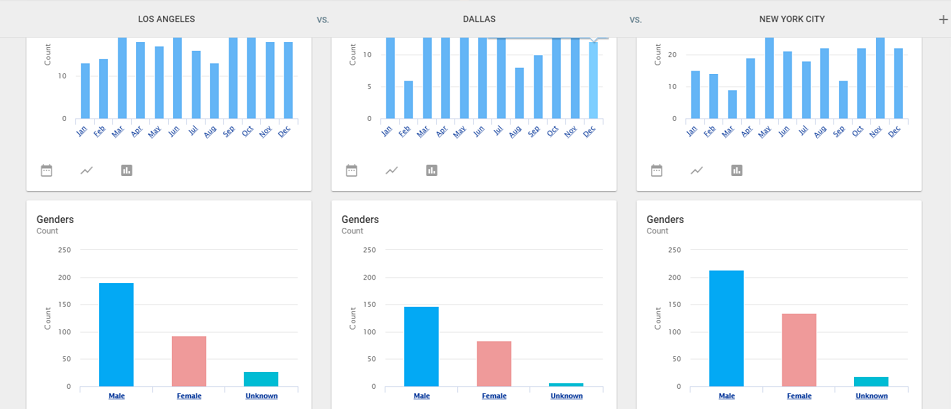
Comparison Boards are Reports that allow a side-by-side comparison of Visuals based on unique values from a Field. Configuration changes on a Visual in one row affect all the Visuals in that row. For more, see the Comparison Boards chapter.
Data View
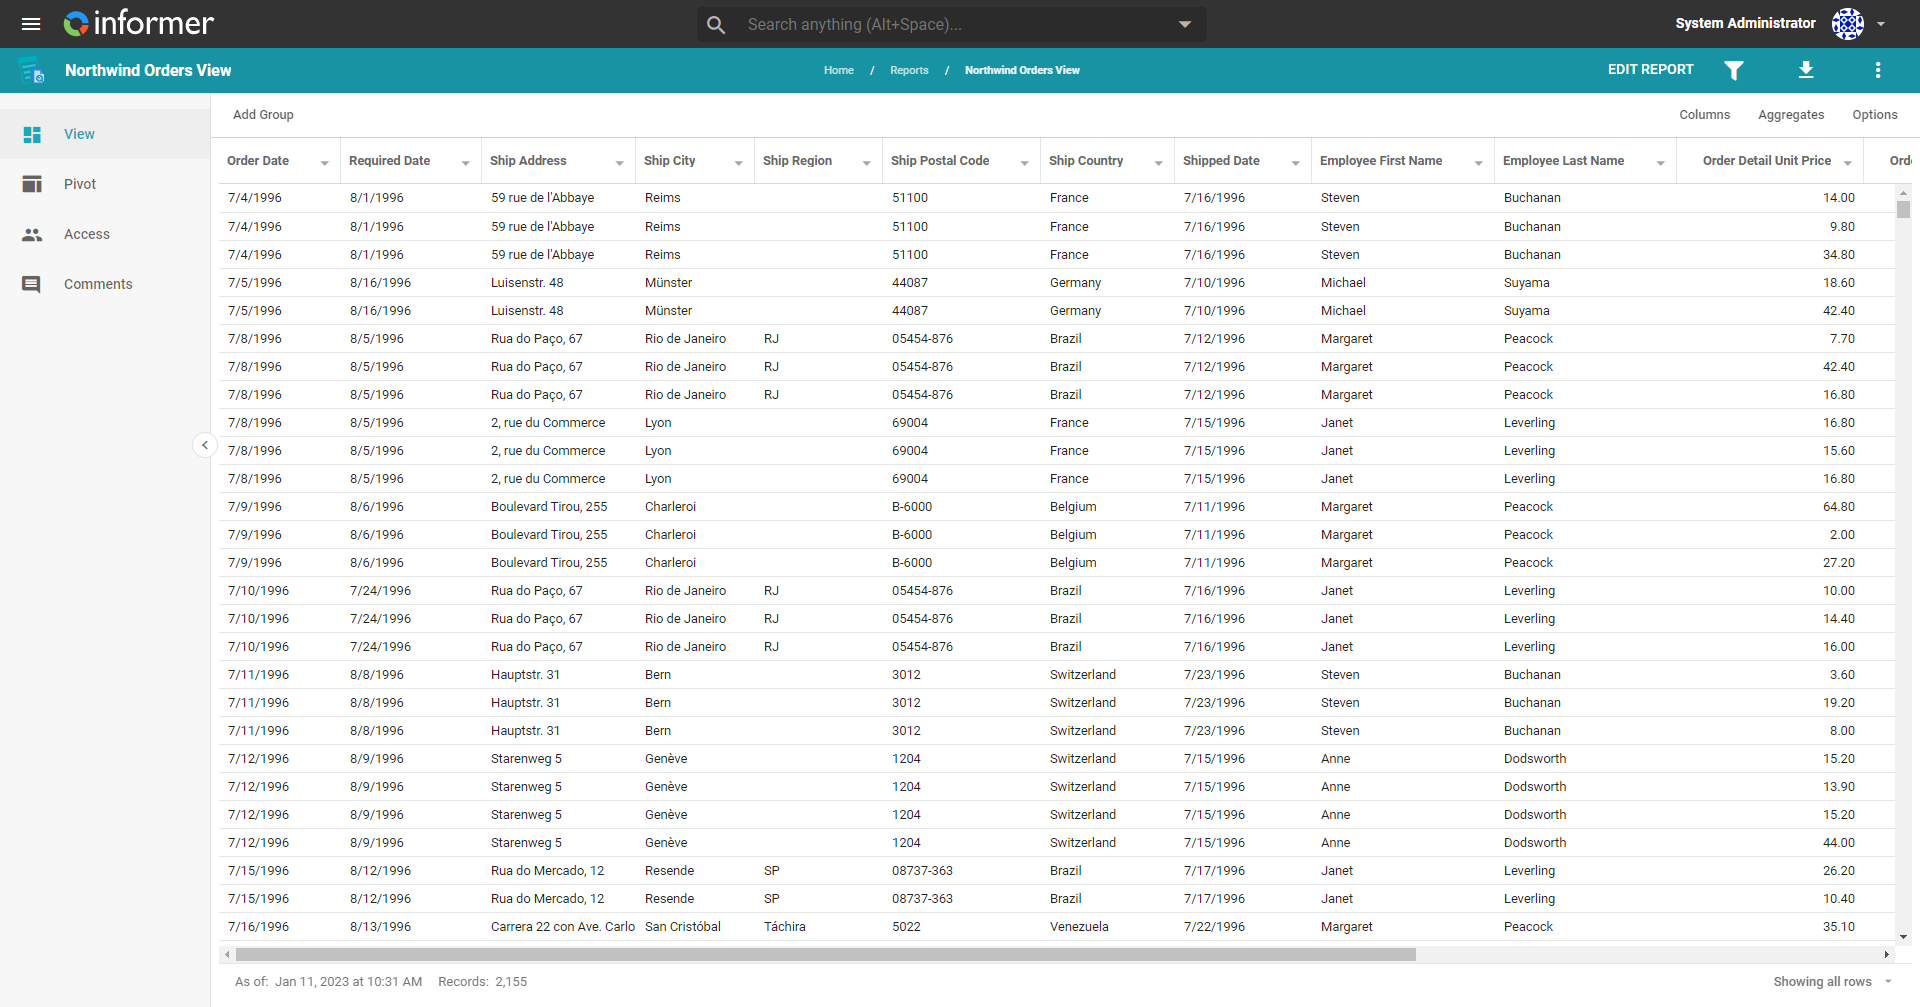
Data Views provide an easy way to view the data within a Dataset. All Fields on the Dataset display in the left panel. Clicking them individually, or clicking Select All in the bottom-left of the page, adds them to the Data View Report. For more, see the Data Views chapter.
Ad hoc Query
Ad hoc Queries do not store data like Datasets. Each time an Ad hoc Query executes, it sends the request to the Datasource and the result set displays inside Informer. Because of this, Ad hoc Query results are not available to share in Visuals.
There are two ways to create an Ad hoc Query: using Native SQL or through the Query Designer. For more, see the Ad hoc Queries chapter.
Native SQL
A Native SQL query is an option for users who know how to write native SQL. This Report type allows more control over a Query's structure: the SQL statement is sent directly to the SQL database as-is to generate the results. Using Native SQL removes access to the UI options the Query Designer provides, but it is particularly useful for migrating pre-existing SQL queries from other systems.
Query Designer
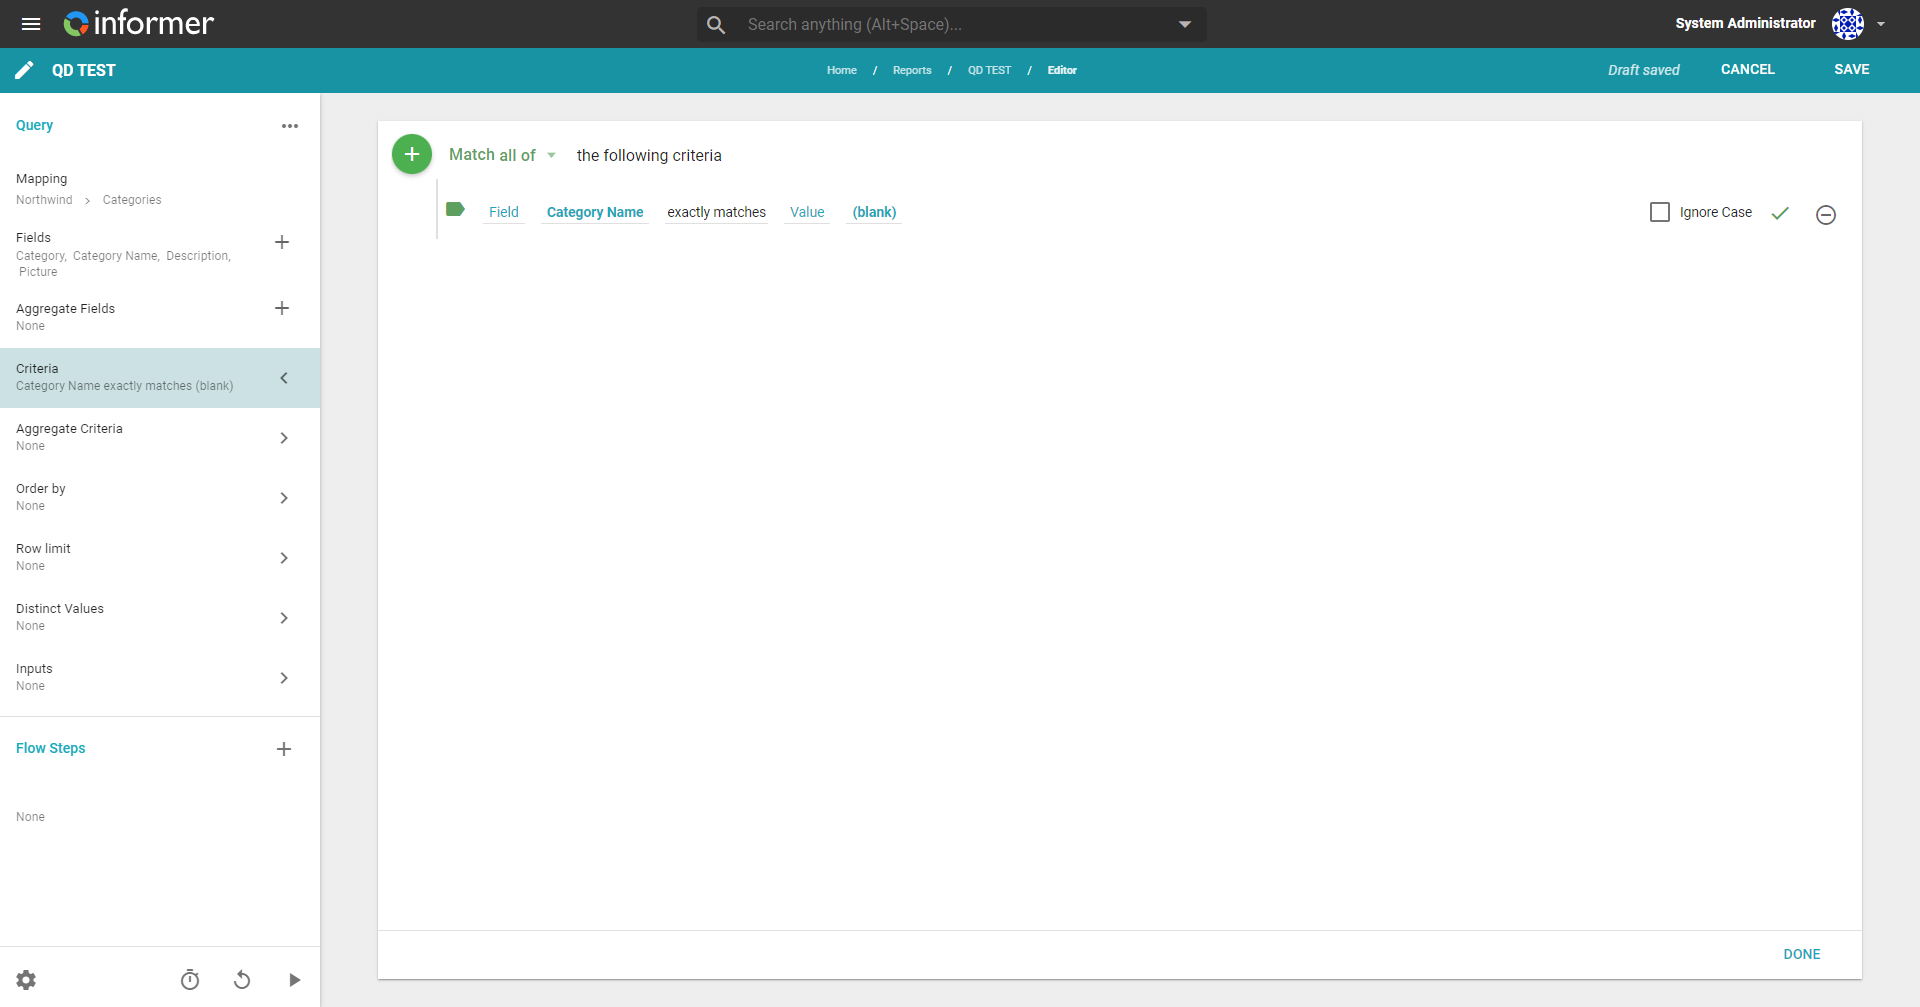
The Query Designer is a user-friendly alternative for those unfamiliar with writing queries in a native database language (SQL, TCL/ECL, and so on). After a few clicks, Informer translates the Query Designer selections into an executable query that goes to the database for processing.
Pixel Perfect
Templates
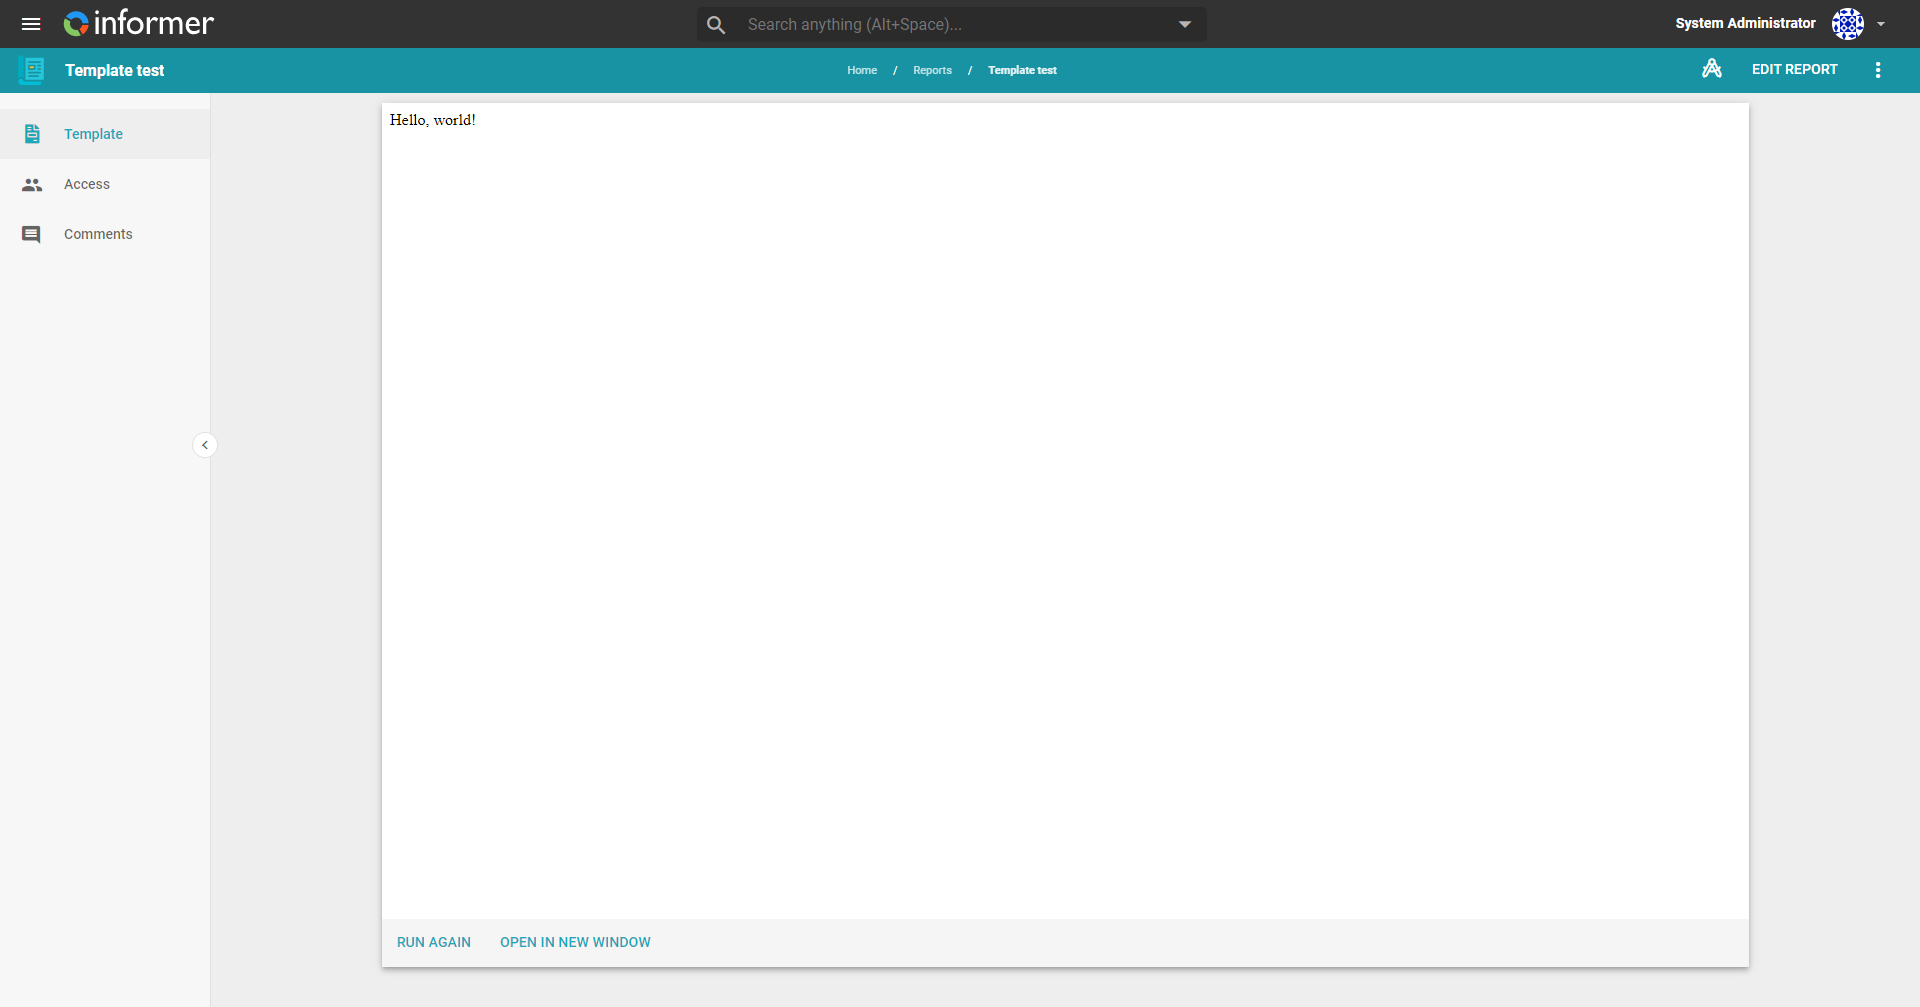
A Template is a customizable format for viewing and exporting data. Because Templates primarily use HTML, anyone (especially those familiar with web development) can create the perfect layout for displaying data, including mail merge letters, itemized invoices, calendars, and more. Informer uses a templating language called Nunjucks to inject data into placeholders in the completed HTML. View Templates directly as a webpage or export them to PDF for easy sharing.