Creating a Visual
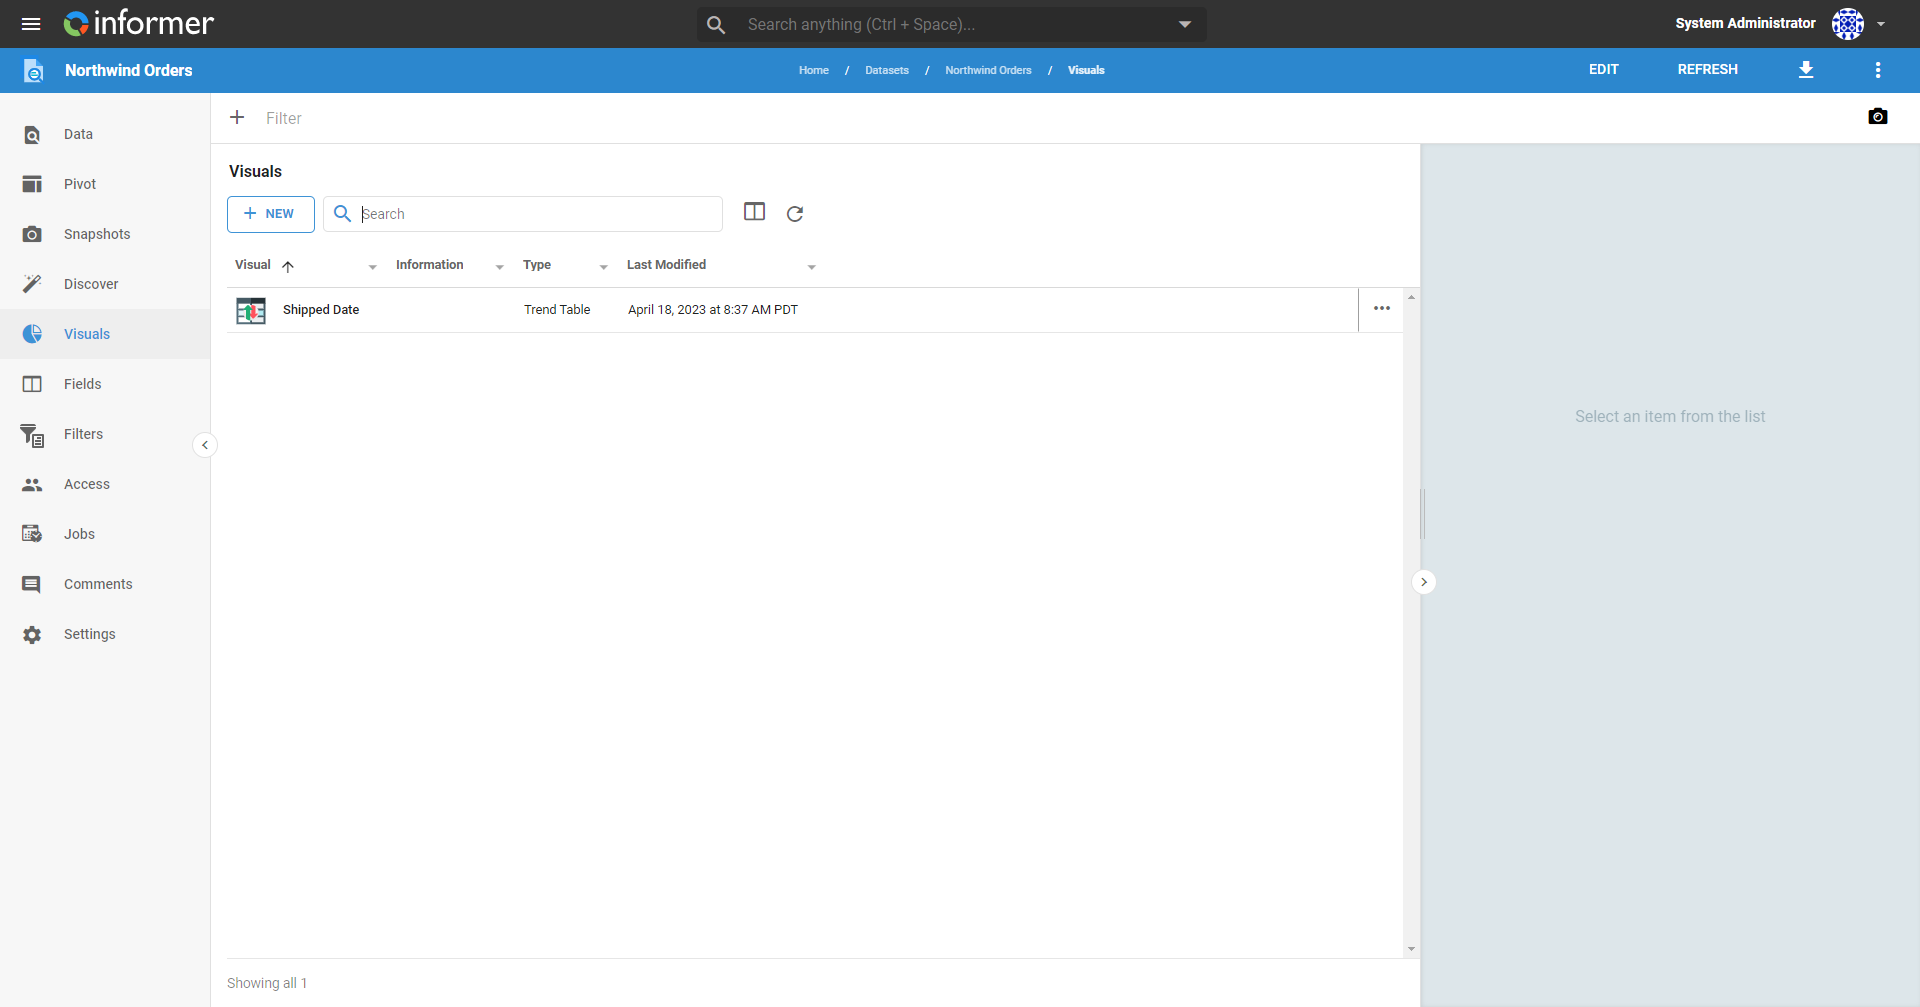
To create a Visual, navigate to the Visuals section on the Dataset by clicking the pie chart icon in the left panel.
If there are already Visuals associated with the Dataset, they display in a list alongside the + New button. Otherwise, the only option is to create a new Visual.
Click New Visual to see a list of available Visuals to create.
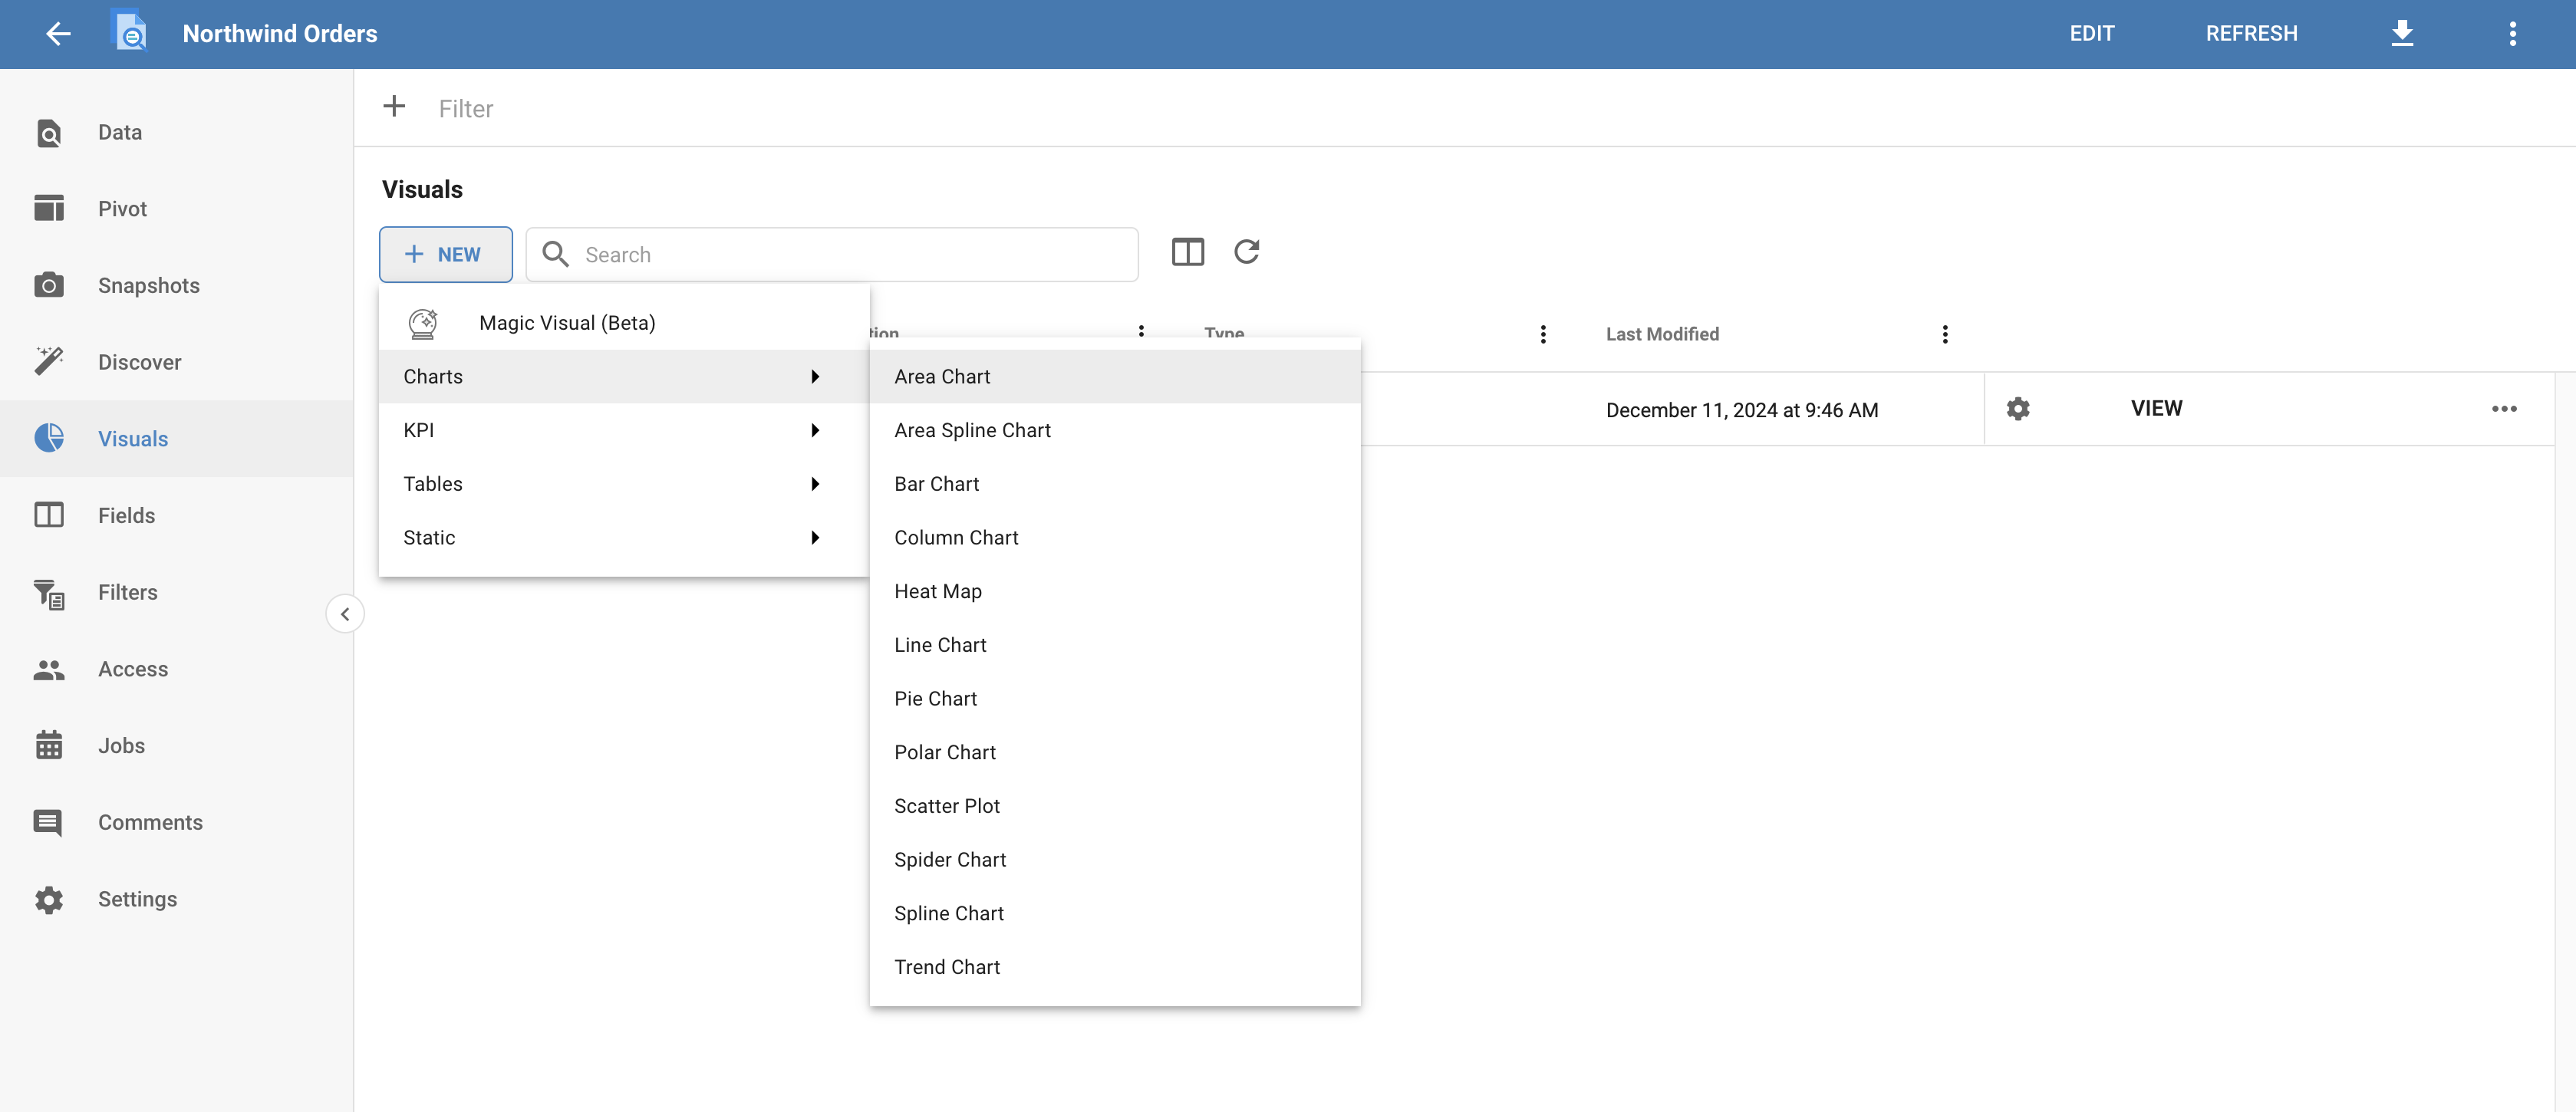
See Types of Visuals for what each kind shows.
Also available through the REST API
Everything on this page is built on Informer's public REST API, the same one the product uses, so your scripts and integrations can do it too. Developer reference: Datasets.