KPIs
Key performance indicators (KPIs) measure performance over time for a specific objective. They provide targets for teams to aim for or milestones to gauge progress, presenting simple performance information at a glance.
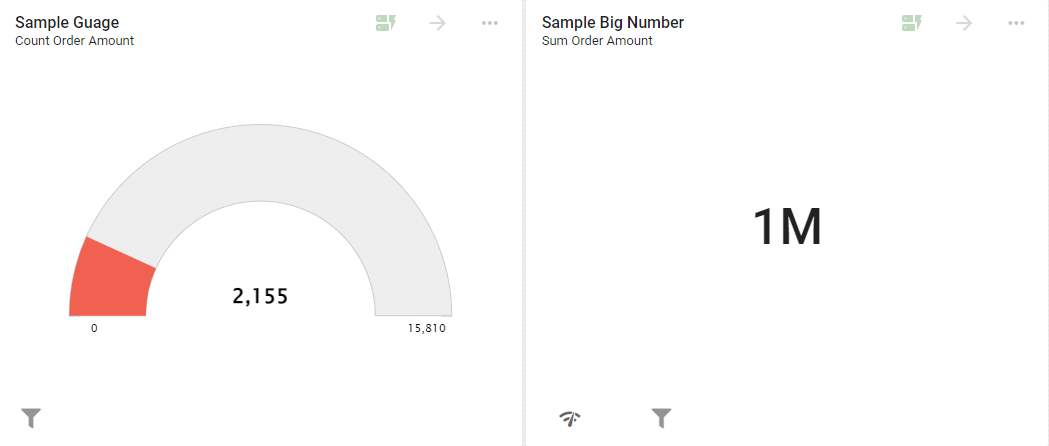
The KPIs below show the average order amount as part of the maximum on the Gauge, and the approximate total number of orders on the Big Number.
Settings
To configure a KPI (Gauge or Big Number), open the Report containing the Visual, click the ... icon in the top-right corner, and select Configure. Both KPIs have two tabs: Settings and Color. The options in the Settings panel depend on whether the KPI is a Big Number or a Gauge.
Big Number
The Big Number Visual displays an aggregate value in a box.
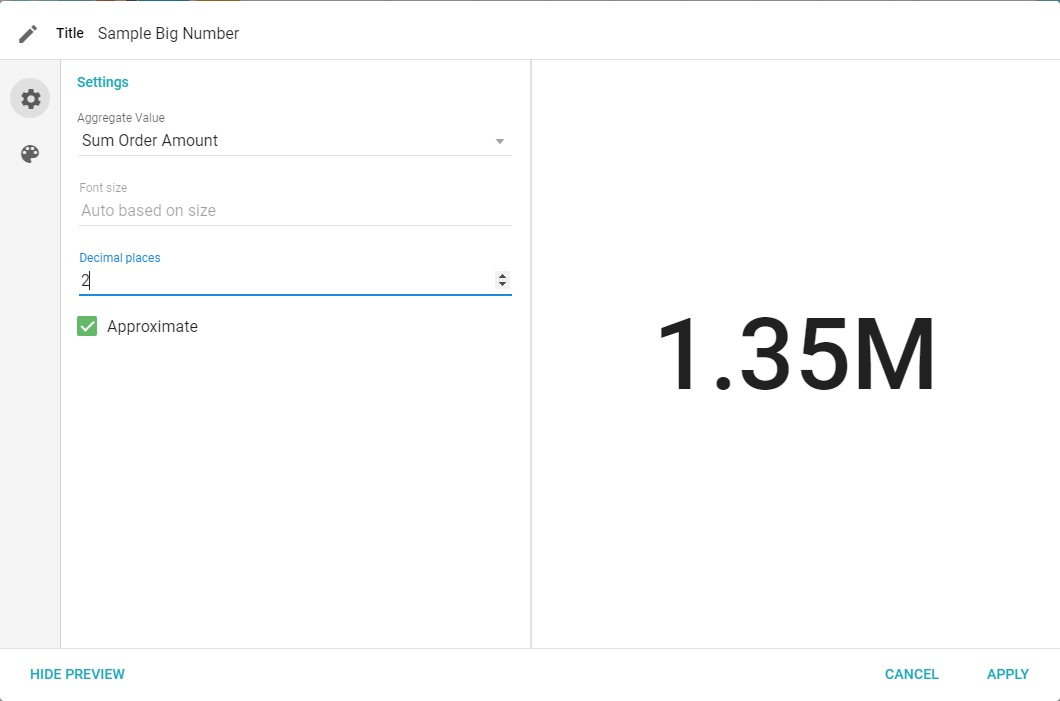
- Aggregate Value: select which Field is used to calculate the value.
- Font size: sets the font size used to display the value. By default, the font size is determined by the size of the Visual's panel.
- Decimal Places: the number of decimal places to display.
- Approximate Value: rounds the value up to the next integer. Useful for large numbers whose exact value is not necessary.
Gauge
The Gauge displays the aggregate but allows a range to be set. It is a good Visual for displaying goals or levels to meet.
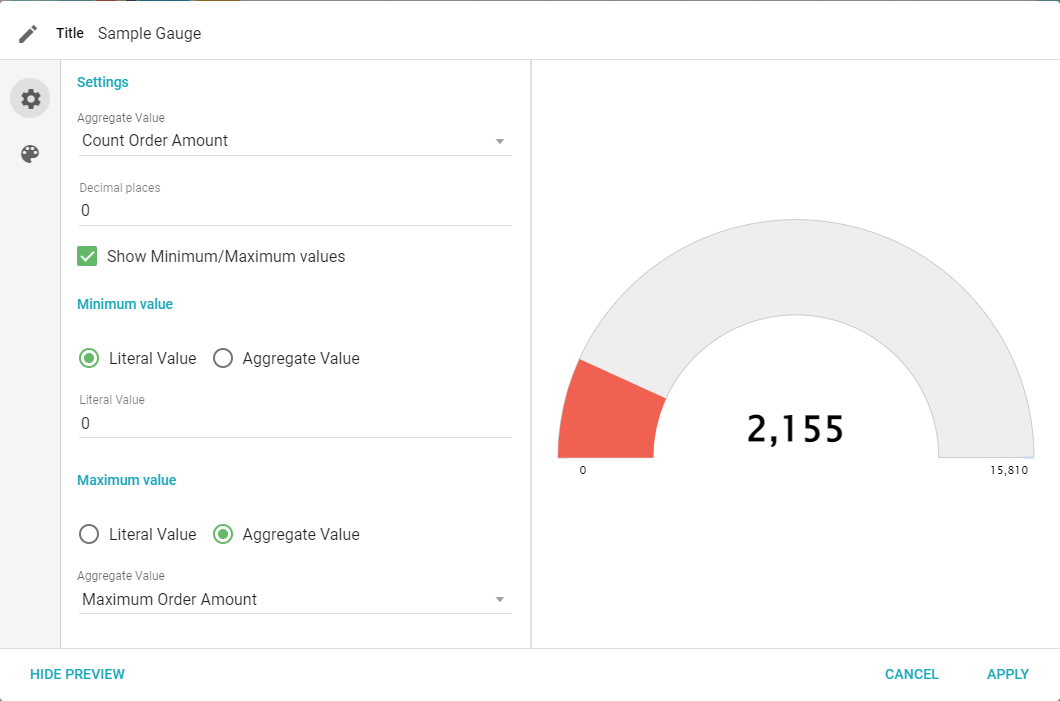
- Aggregate Value: select which Field to calculate the value.
- Decimal Places: the number of decimal places to display.
- Show Minimum/Maximum Values: shows the minimum and maximum values on either side of the gauge.
- Minimum value: sets the minimum value of the gauge. Use a literal value or an aggregate of an existing column.
- Maximum value: sets the maximum value of the gauge. Use a literal value or an aggregate of an existing column.
Color
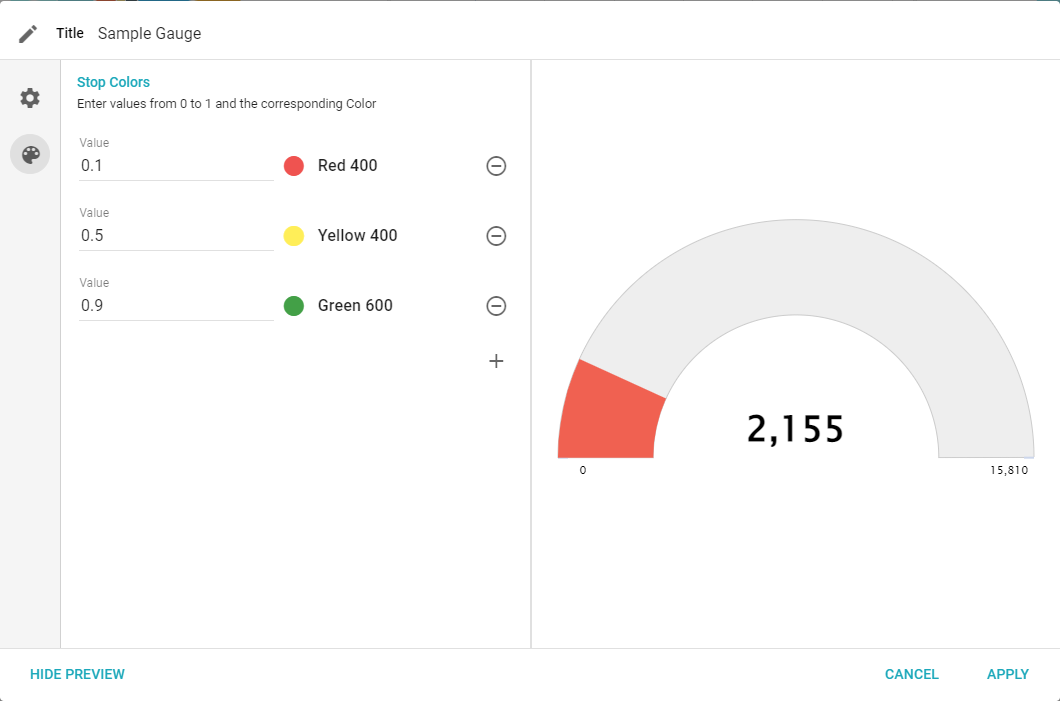
The color is set according to the percentage of the total value. If the value is 50% of the total, the color is closer to yellow. Stop Colors are the colors the gauge gradually transitions between, and set the values where it changes from one to the next. Use the - icon to the right of each color to remove a Stop Color, and the + icon below the list to add one.