Creating a Pivot Table
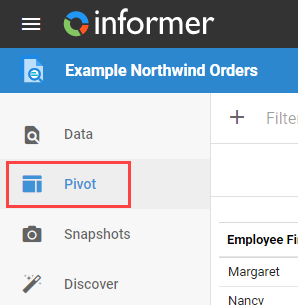
To create a Pivot Table, go to the Dataset listing page, open a Dataset containing data, and click the Pivot icon in the left panel.
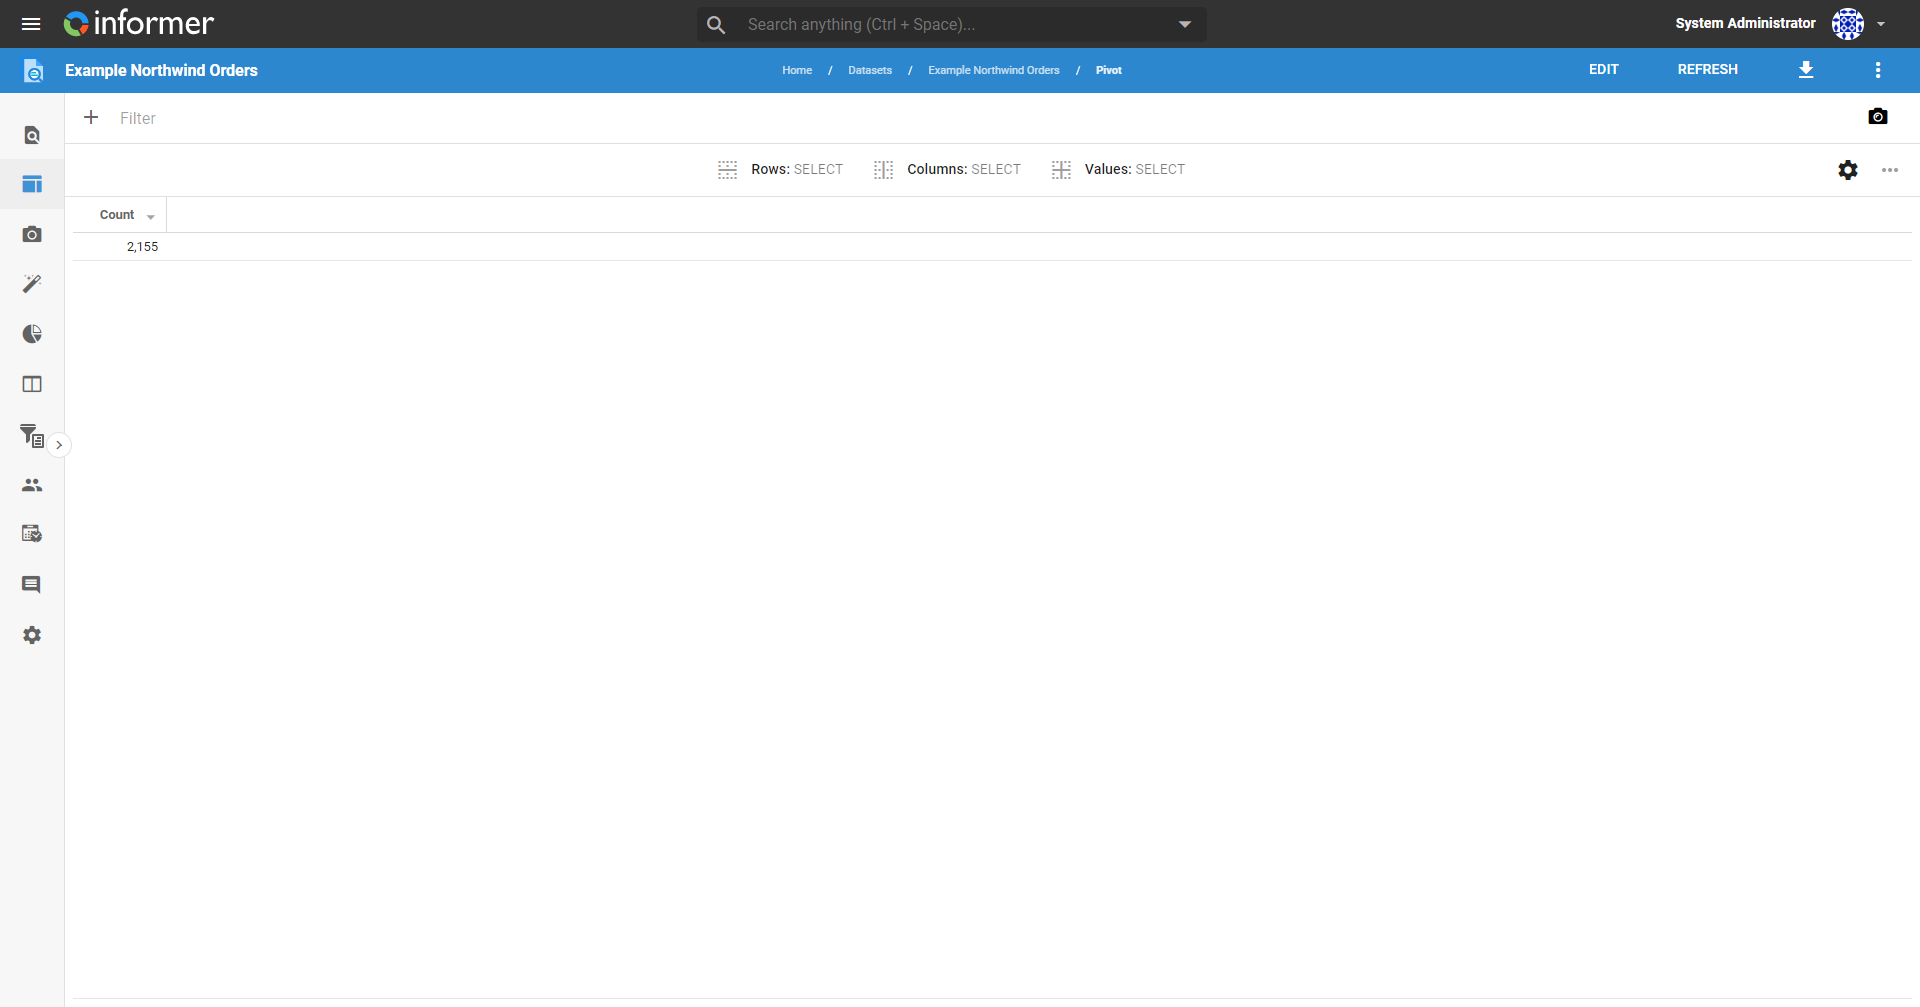
The default view in a Pivot Table is a single cell with a raw count of results, with no row or column groupings. For more useful information, configure rows, columns, and value groupings using the three dropdowns along the top of the Pivot Table.
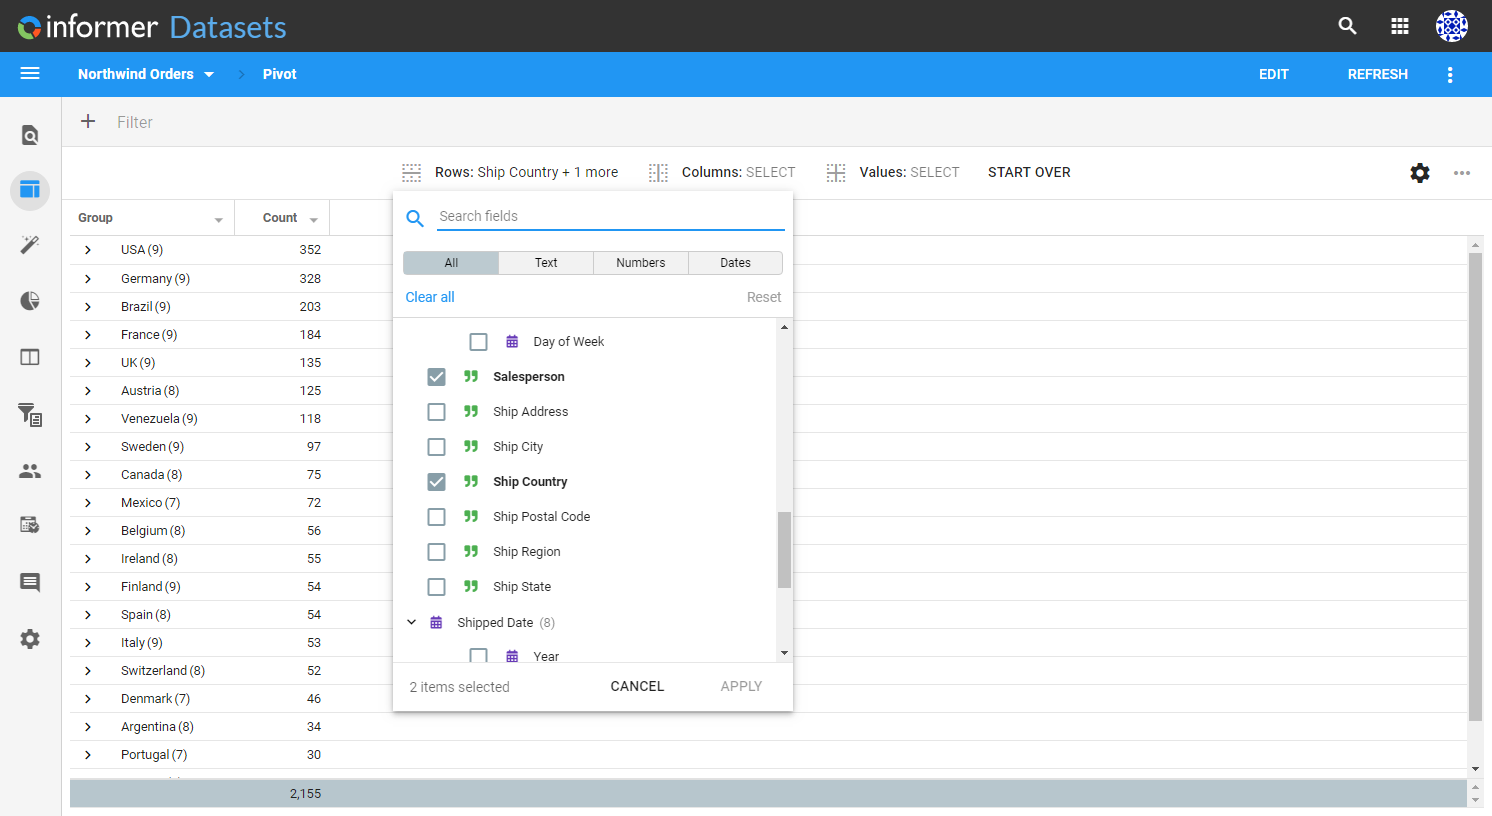
Clicking Rows along the top bar shows a dropdown containing all the Fields in the result set. Check Field names and click Apply to re-render the Pivot Table with row groupings for each checked Field's unique values. Additional row groupings nest under one another in selection order. For example, checking a country Field first and a salesperson Field second groups the results by country, then by salesperson.
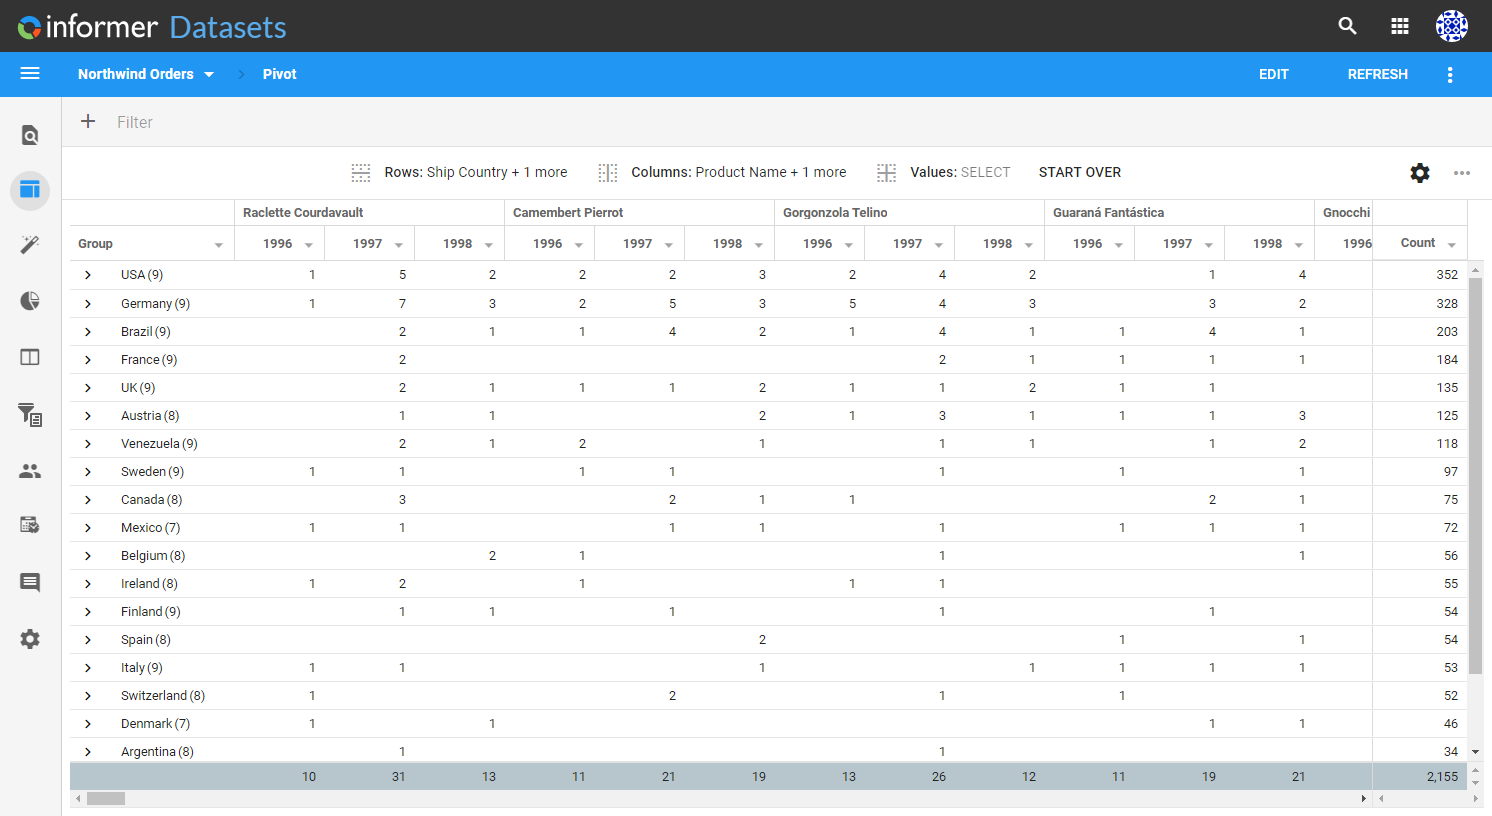
Clicking Columns along the top bar shows a dropdown containing all the Fields in the result set. Check Field names and click Apply to re-render the Pivot Table with column groupings for each checked Field's unique values. Additional column groupings nest under one another in selected order.
Clicking Values along the top bar shows a dropdown containing all the Fields in the result set, along with aggregate options for each Field. Check aggregate types and click Apply to change each cell's value to the selected Field aggregation. Each additional value selection gets its own sub-column. For example, selecting both the total and average aggregations for an Order Amount Field adds two sub-columns to the Pivot Table.
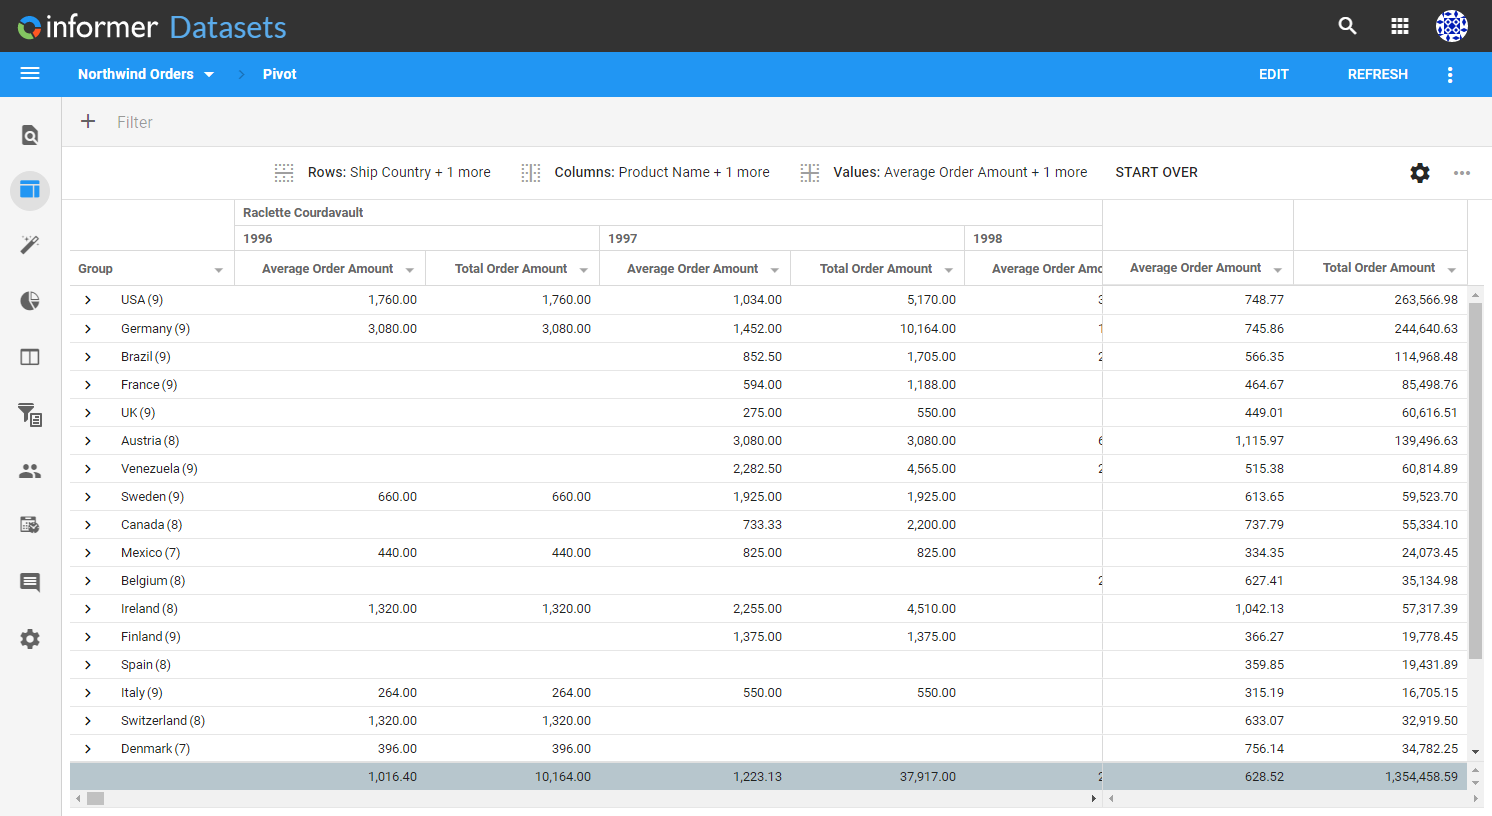
A Start Over option is available after configuring rows, columns, or values. Click Start Over to reset the Pivot Table to its defaults.