Pivot Table settings
Pivot Tables let you summarize, analyze, explore, and present summaries of large amounts of data. They are designed for querying large amounts of data in a user-friendly way: summarizing data by categories and subcategories, drilling down to details for areas of interest, moving rows to columns or columns to rows (pivoting) to see different summaries, and filtering, sorting, grouping, and conditionally formatting the most useful subset so you can focus on the information you want.
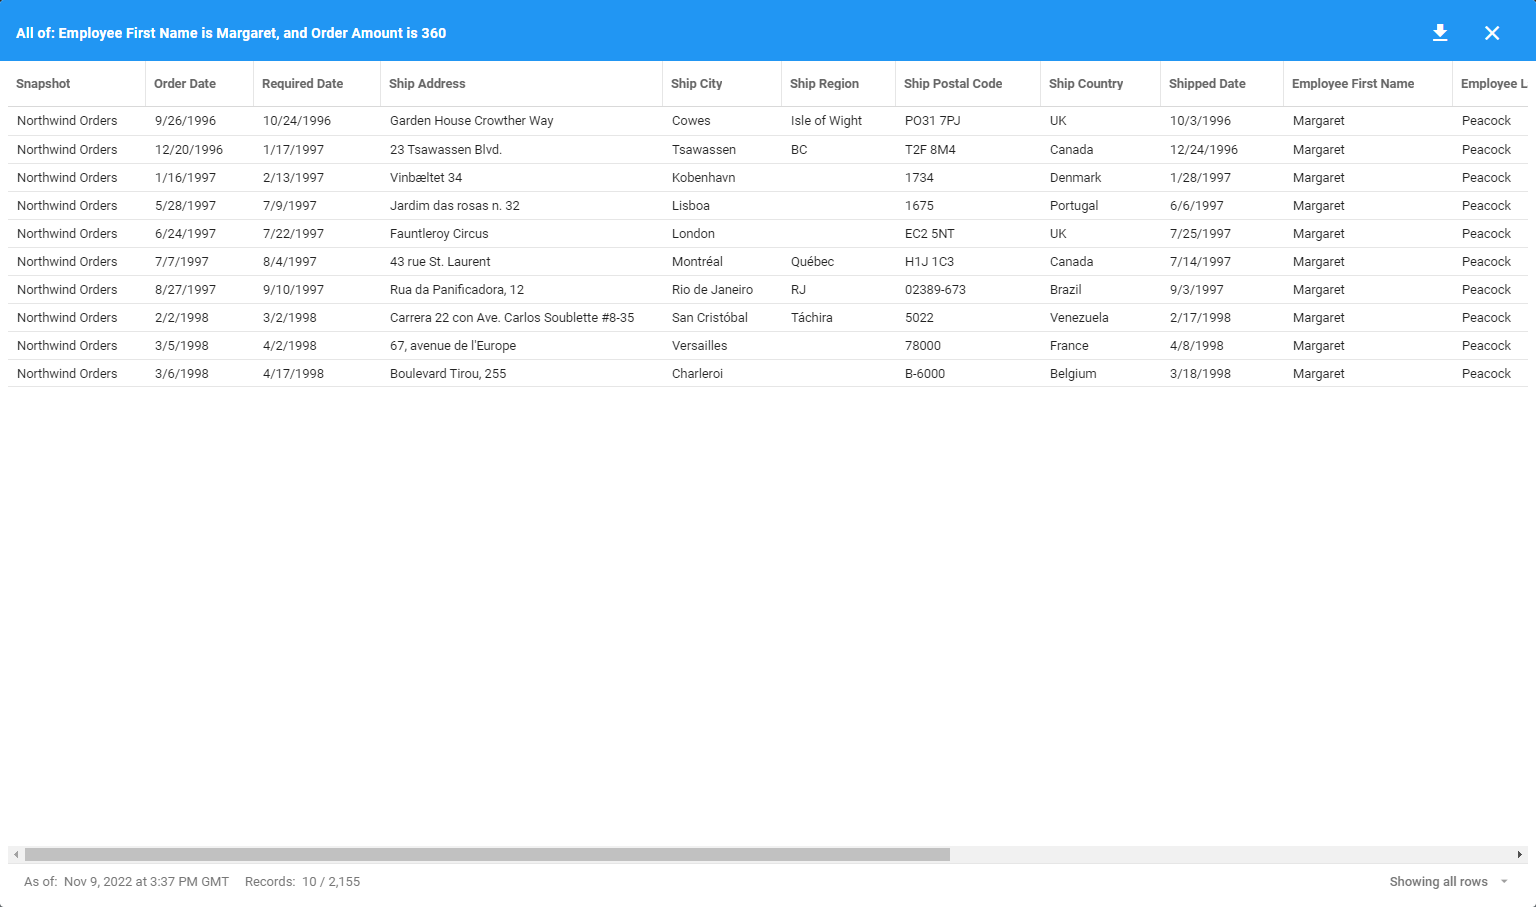
A Pivot Table can let you quickly see more information on a specific part of a Dataset, for example pivoting to see the full details of the data behind a single employee's sales for a specific product.
Settings
In addition to full control over rows, columns, and values, a number of display options change the overall layout of the data in a Pivot Table.
To access the settings, click the Configure gear icon in the top-right of the Pivot Table. A settings panel opens with configurable options for layout, ordering, limits, and column-by-column formatting, along with a preview panel.

Layout
This section changes the display of nested row groupings. You can also add more unique row or column groupings, following the process in Creating a Pivot Table.
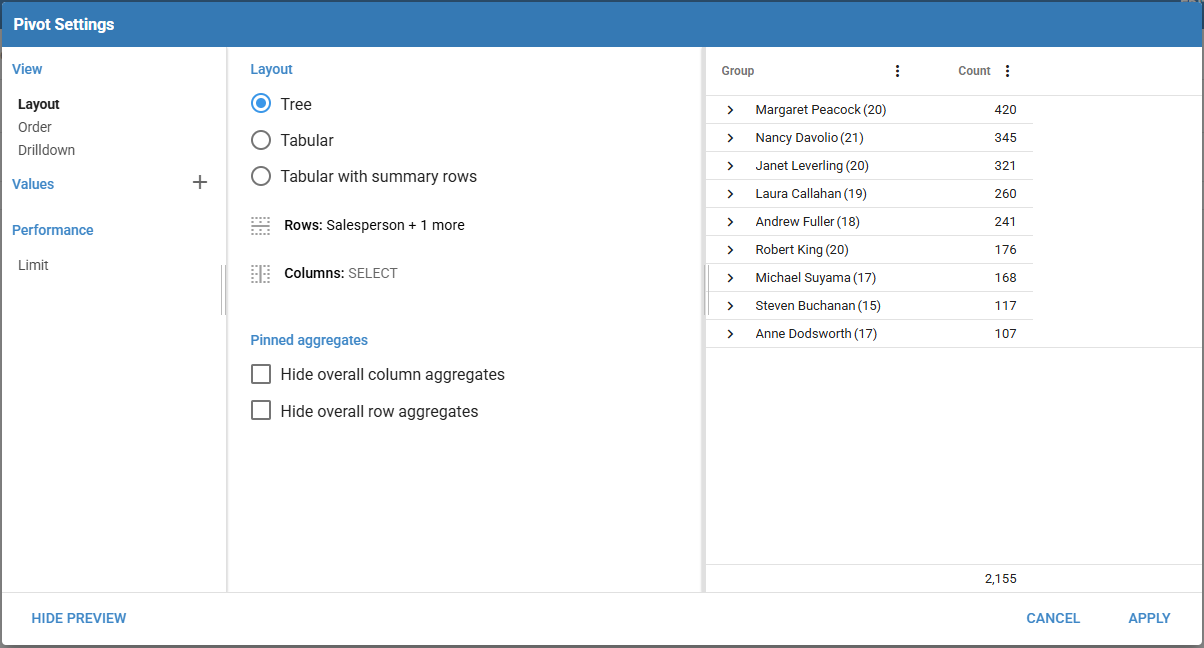
The first layout type is Tree, where each top-level grouping has a drilldown option to show lower-level groupings. Any sub-totals of a row's values display on the right sidebar.
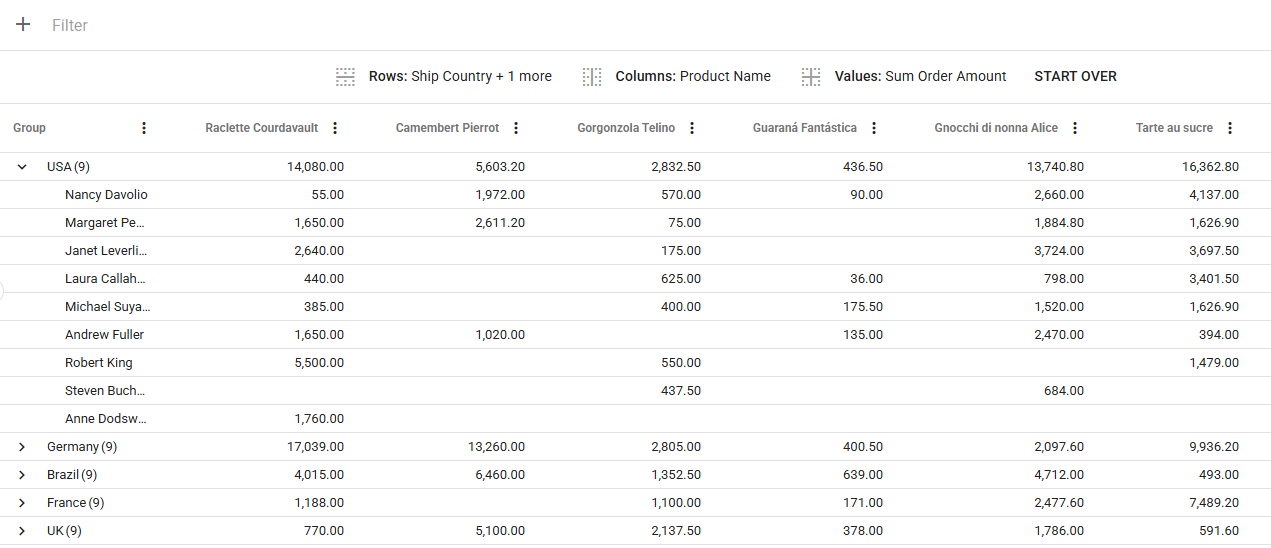
The next type is Tabular, the default for new Pivot Tables. This normalizes all row groupings, removing the need to click top-level groupings to expand them. Sub-totals still display on the right sidebar. Note that this option removes the sub-totals for the top-level grouping.
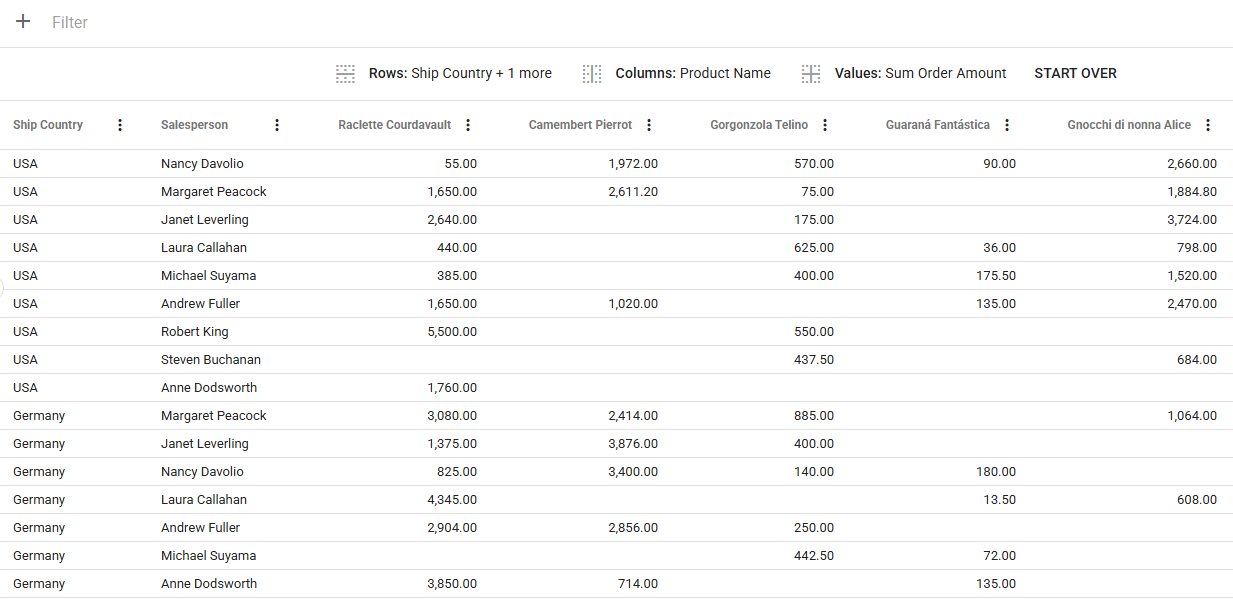
The third type is Tabular with summary rows. This is the same as the Tabular layout with the addition of top-level summary rows.
Order
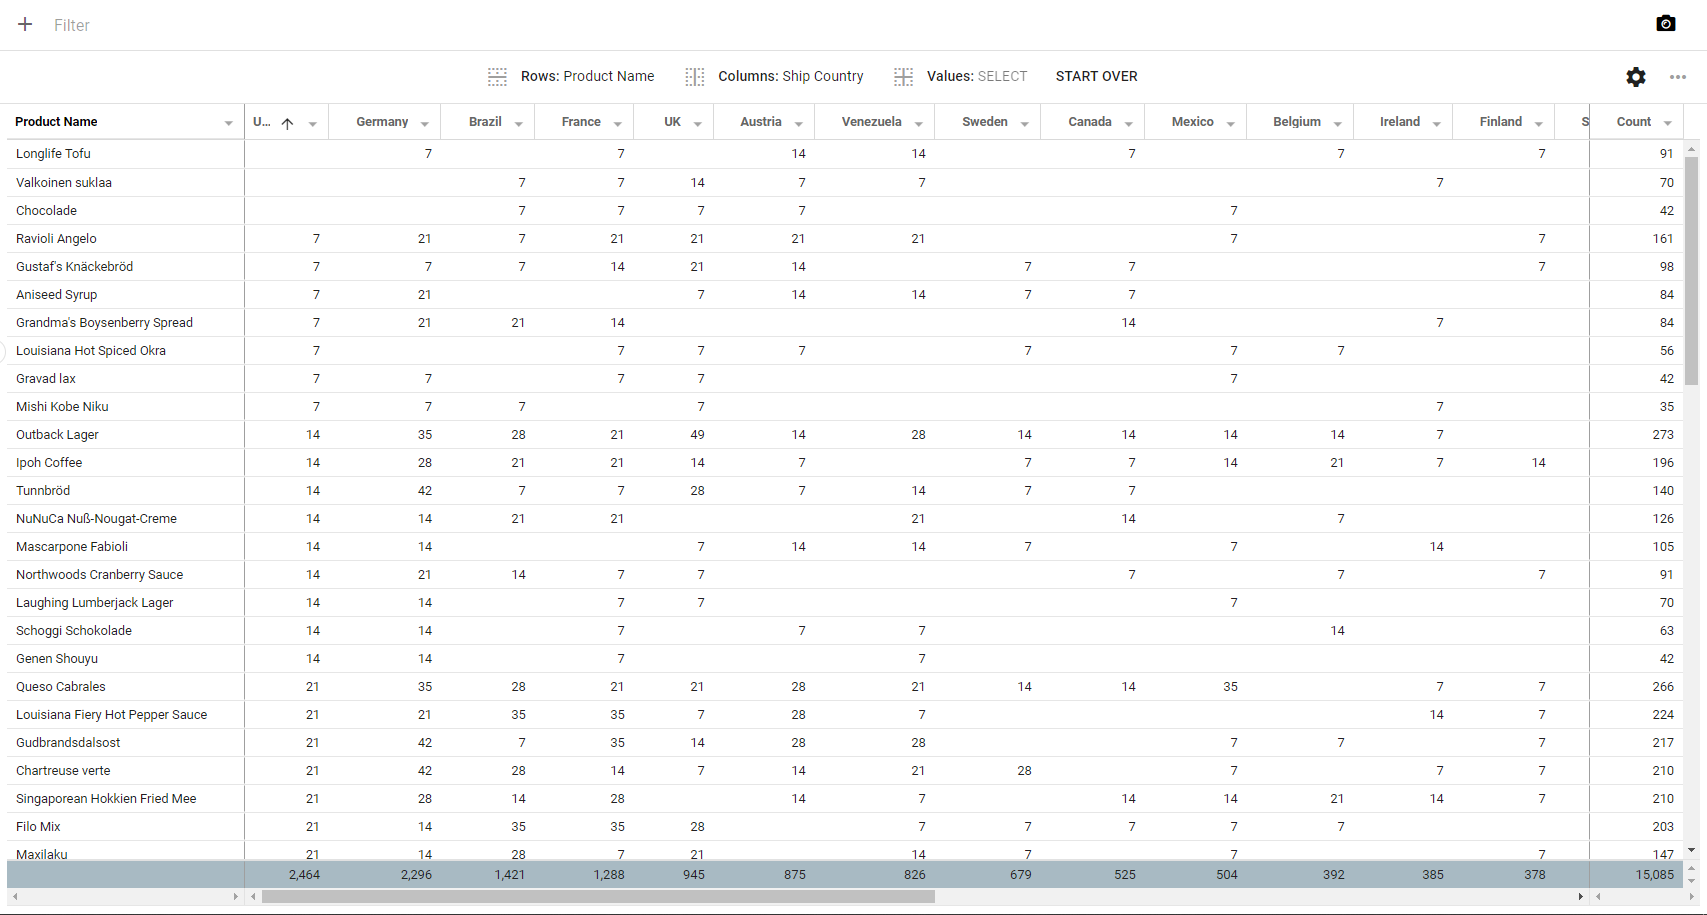
This section changes the ordering of columns and rows based on their values. Sorting by value ascending or value descending sorts the rows and columns by their respective value in the sidebar or footer.
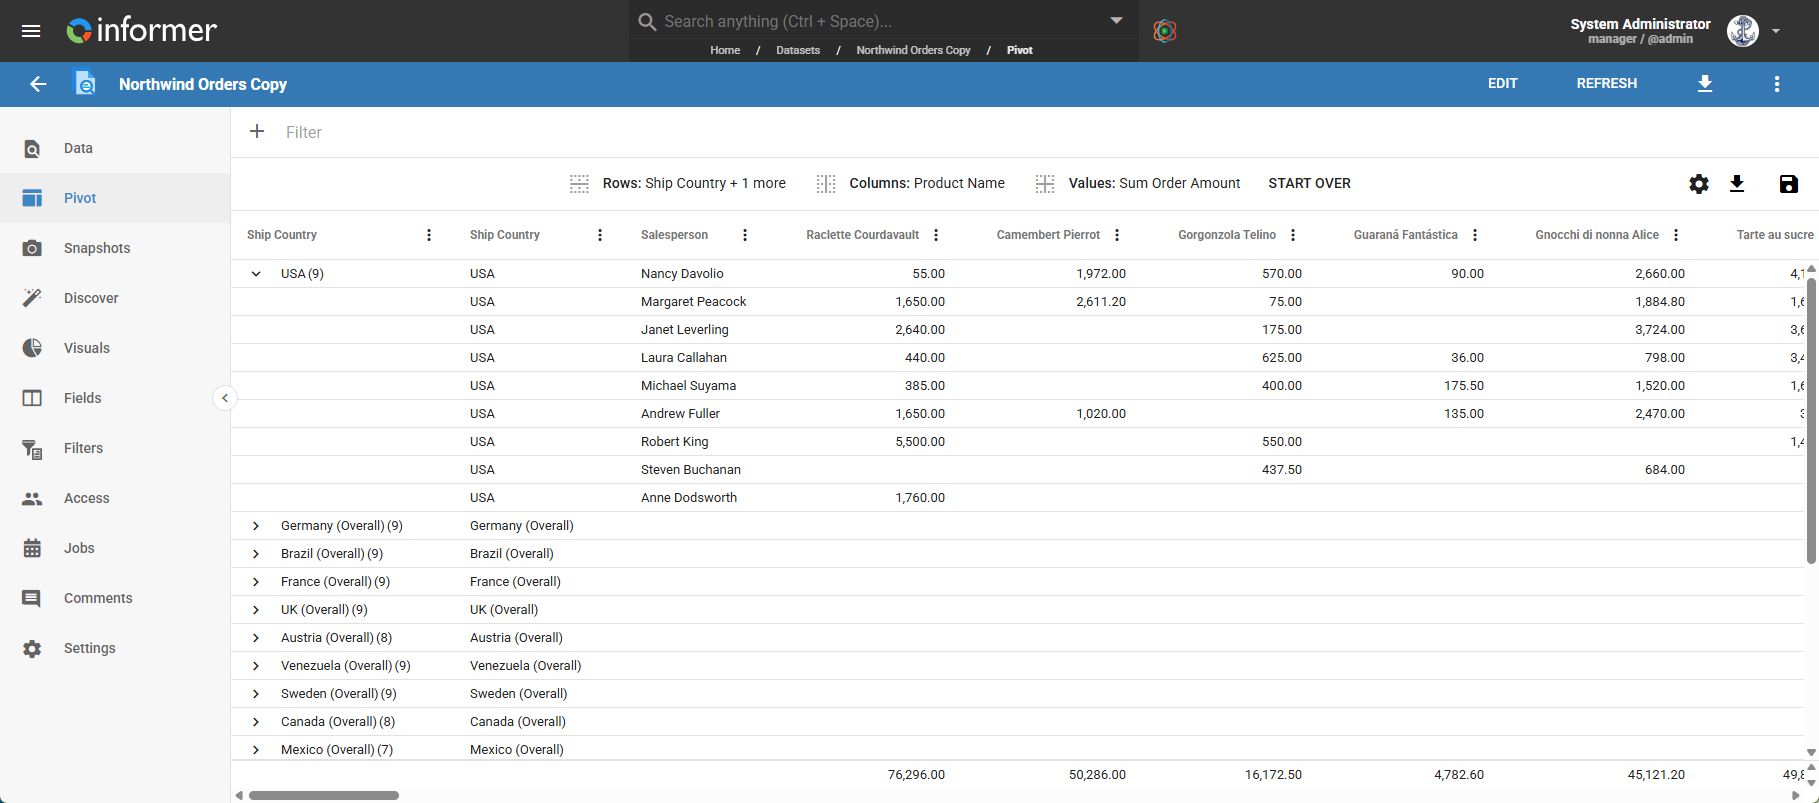
Sorting by group headers ascending or group headers descending sorts the rows and columns by their headers.
Drilldown
This section enables or disables the ability to drill down into a specific cell's data by clicking it. Disabling it is helpful for restricting end users to a big-picture view of the data rather than the raw records.
Values
This section customizes the header, formatting, and conditional color formatting for each value or aggregate in a Pivot Table.
Value
This section changes the aggregate type and header for an existing value, or adds new values. The default name of a value's column is the aggregate type followed by the column name, for example Total Order Amount.
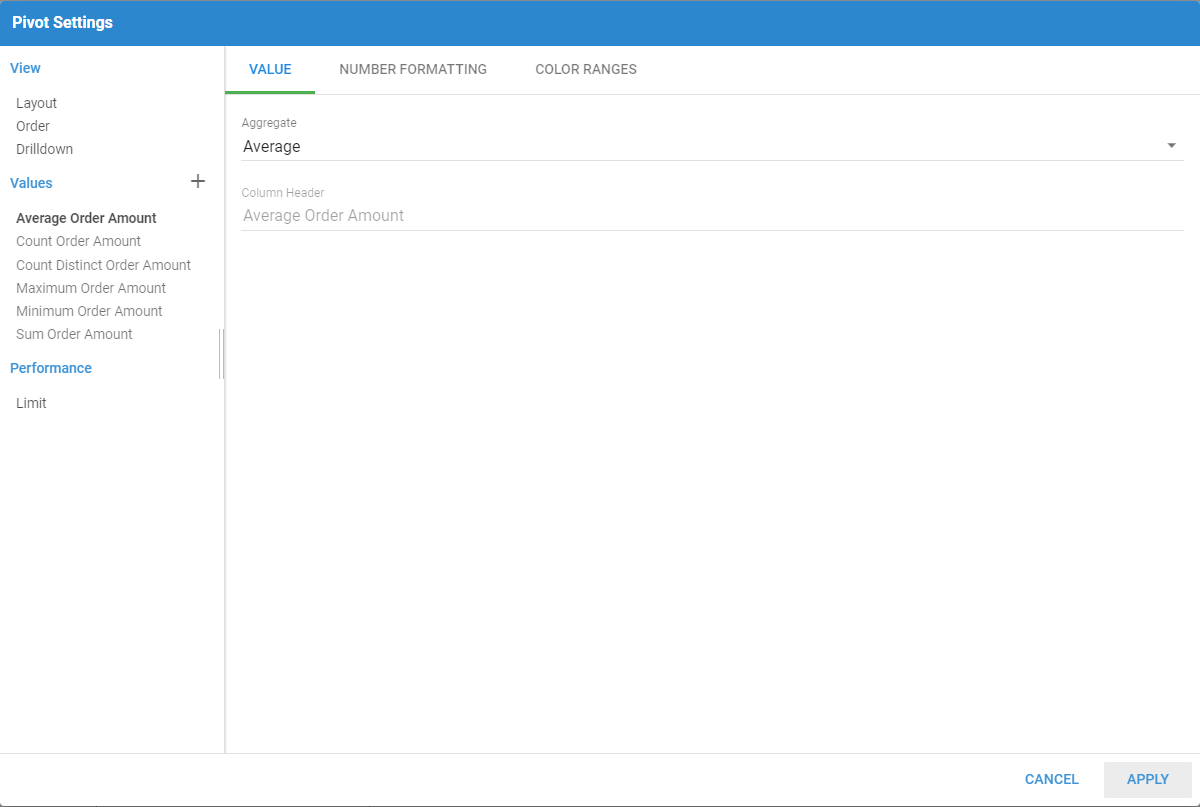
Click the + button next to the Values header to open the Field chooser and select which Fields to aggregate. Alternatively, from the Field chooser, click the Custom tab to create and use custom expressions.
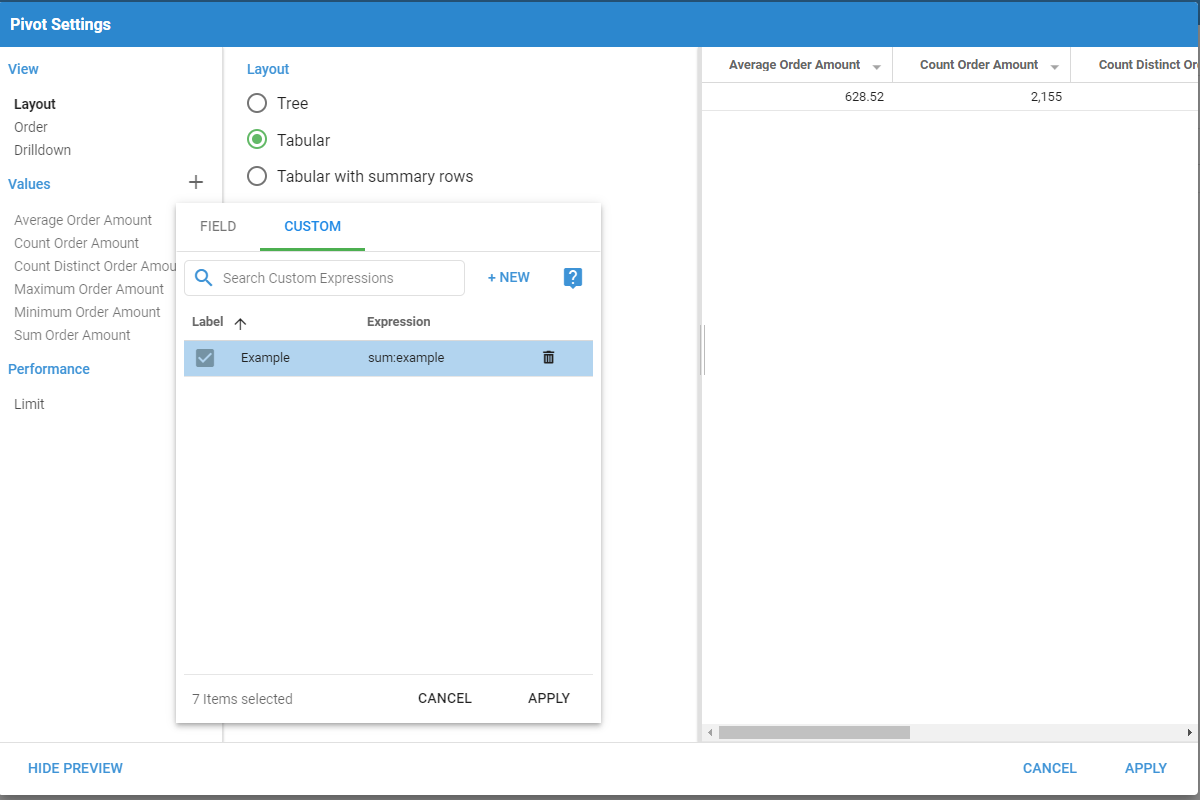
- Click the + New button at the top of the chooser to create a new custom expression.
- Enter a Label to identify the expression.
- Enter the aggregation expression into the expression field. Clicking the ? button opens a dialog with example expressions and aggregations.
- Click the checkbox next to the Label of the desired expressions. Clicking the trash can icon on the right side of the table deletes the expression after you click Apply.
- Click Apply to add it to the Pivot Table.
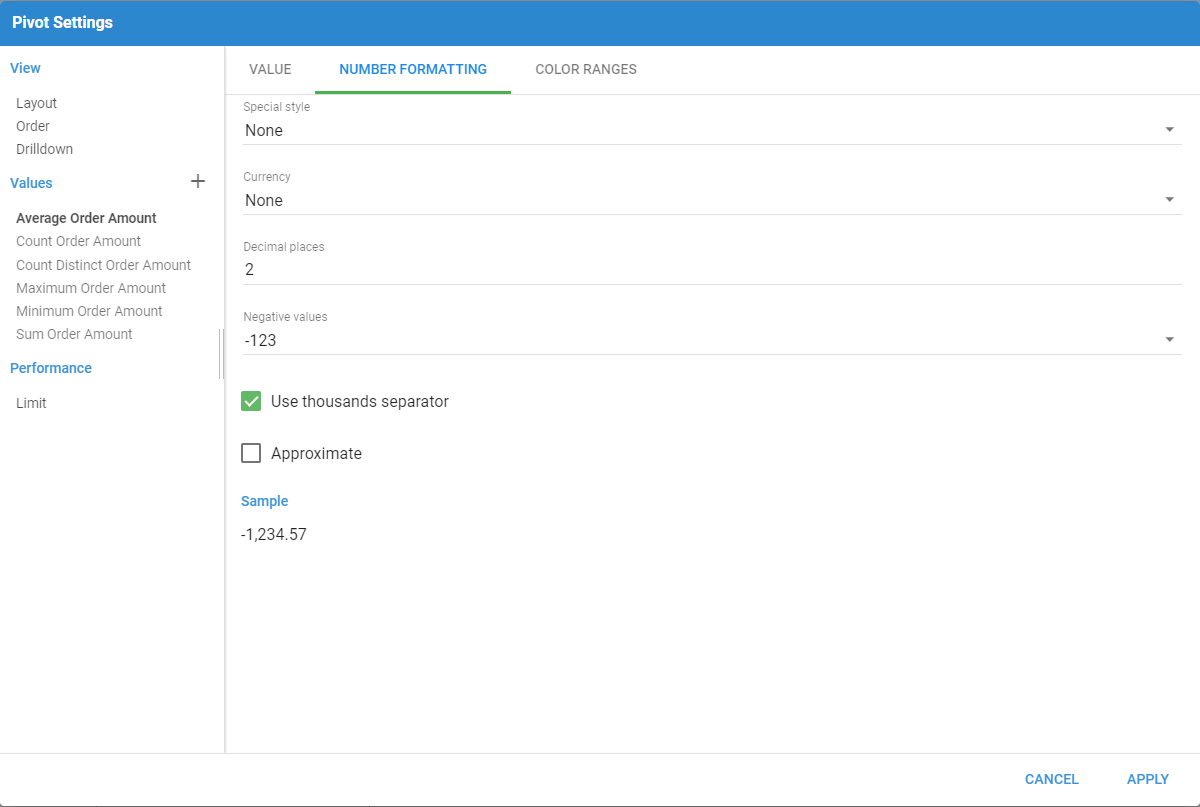
Number formatting
This section customizes how numeric values appear, such as using a currency symbol, how many decimal places to display, or how negative values look.
Color ranges
This section configures conditional color formatting for the values in columns. Clicking a color value gives color options to choose from, or enter a specific color's hex value. Then set the number ranges the formatting should apply to. Click the + icon to add another color formatting rule.
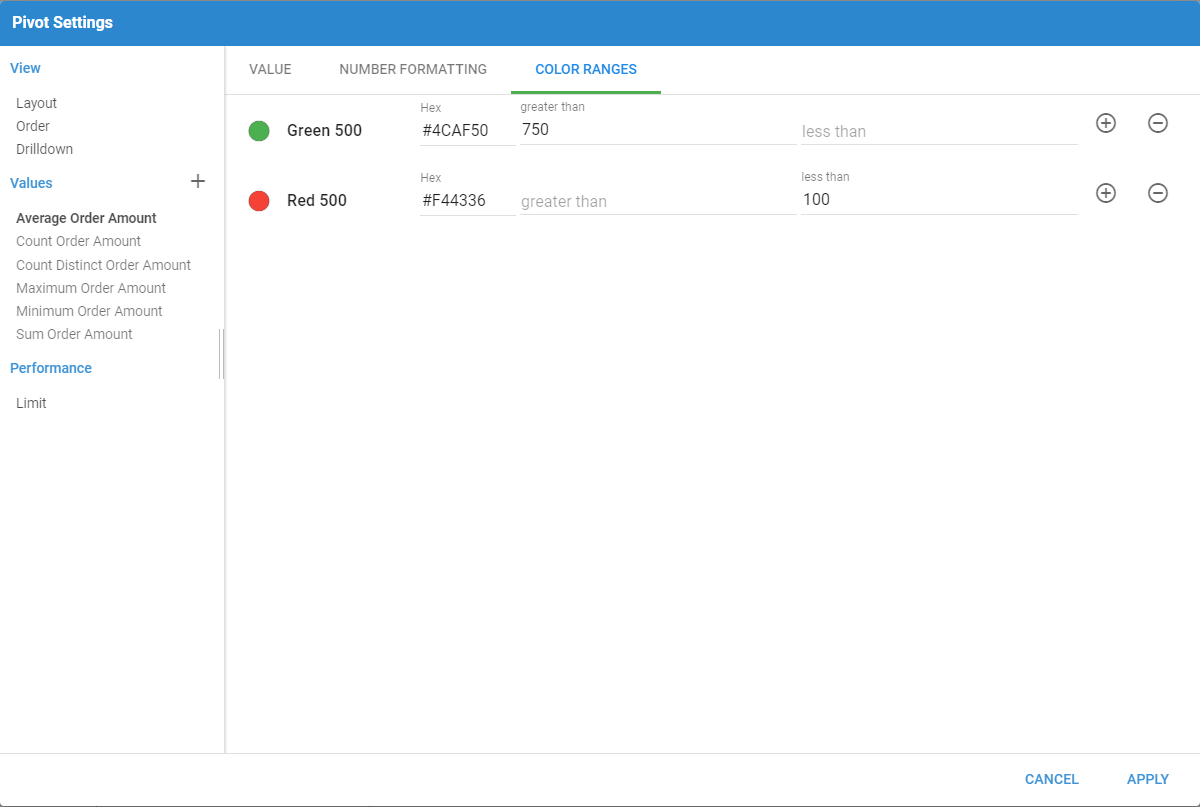
Be sure to click Apply after making any changes to save them.
Performance
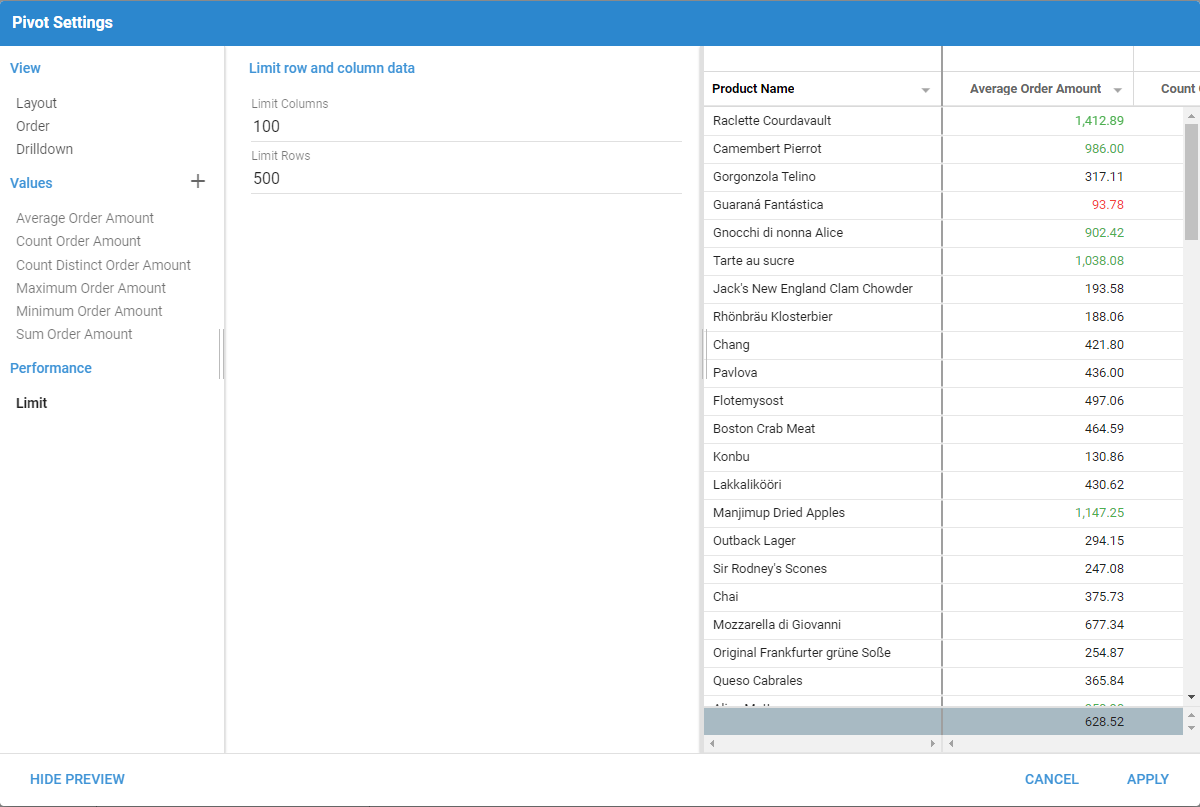
This section sets limits on the number of columns or rows included in the Pivot Table. This is useful when a Pivot Table is built from millions of records with many unique group values but end users are only concerned with a certain number of groupings.
Exporting
To share a Pivot Table, export it. After customizing a Pivot Table, use the options in the Actions menu in the top right to export it to a PDF or CSV file, or, if the results come from a Dataset, save it as a permanent Visual.

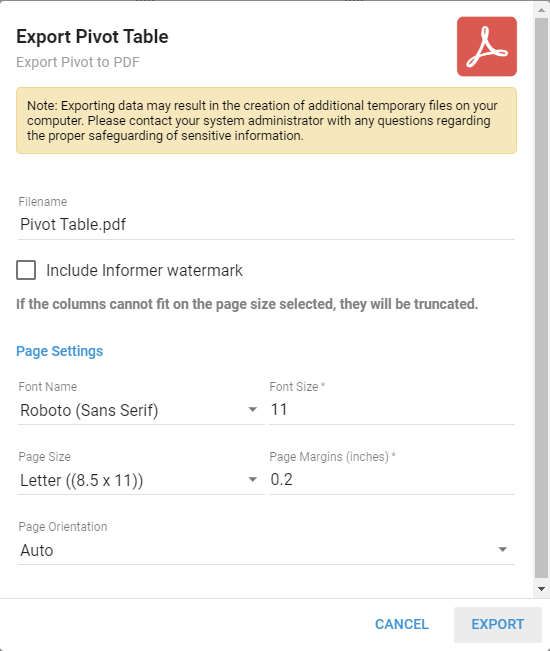
Exporting a Pivot Table as a PDF lets you set up the PDF with custom filenames, fonts, and page settings, and include a watermark if desired.