What is a Pivot Table?
Pivot Tables are one of the Visual options for Datasets, Dashboard Reports, and Comparison Board Reports. They are a way to summarize a larger data table by organizing the information into related groups based on sums, averages, or other statistics. Depending on the style formatting, there are often footer rows or summary rows that give breakdowns of an entire group's aggregate statistics.
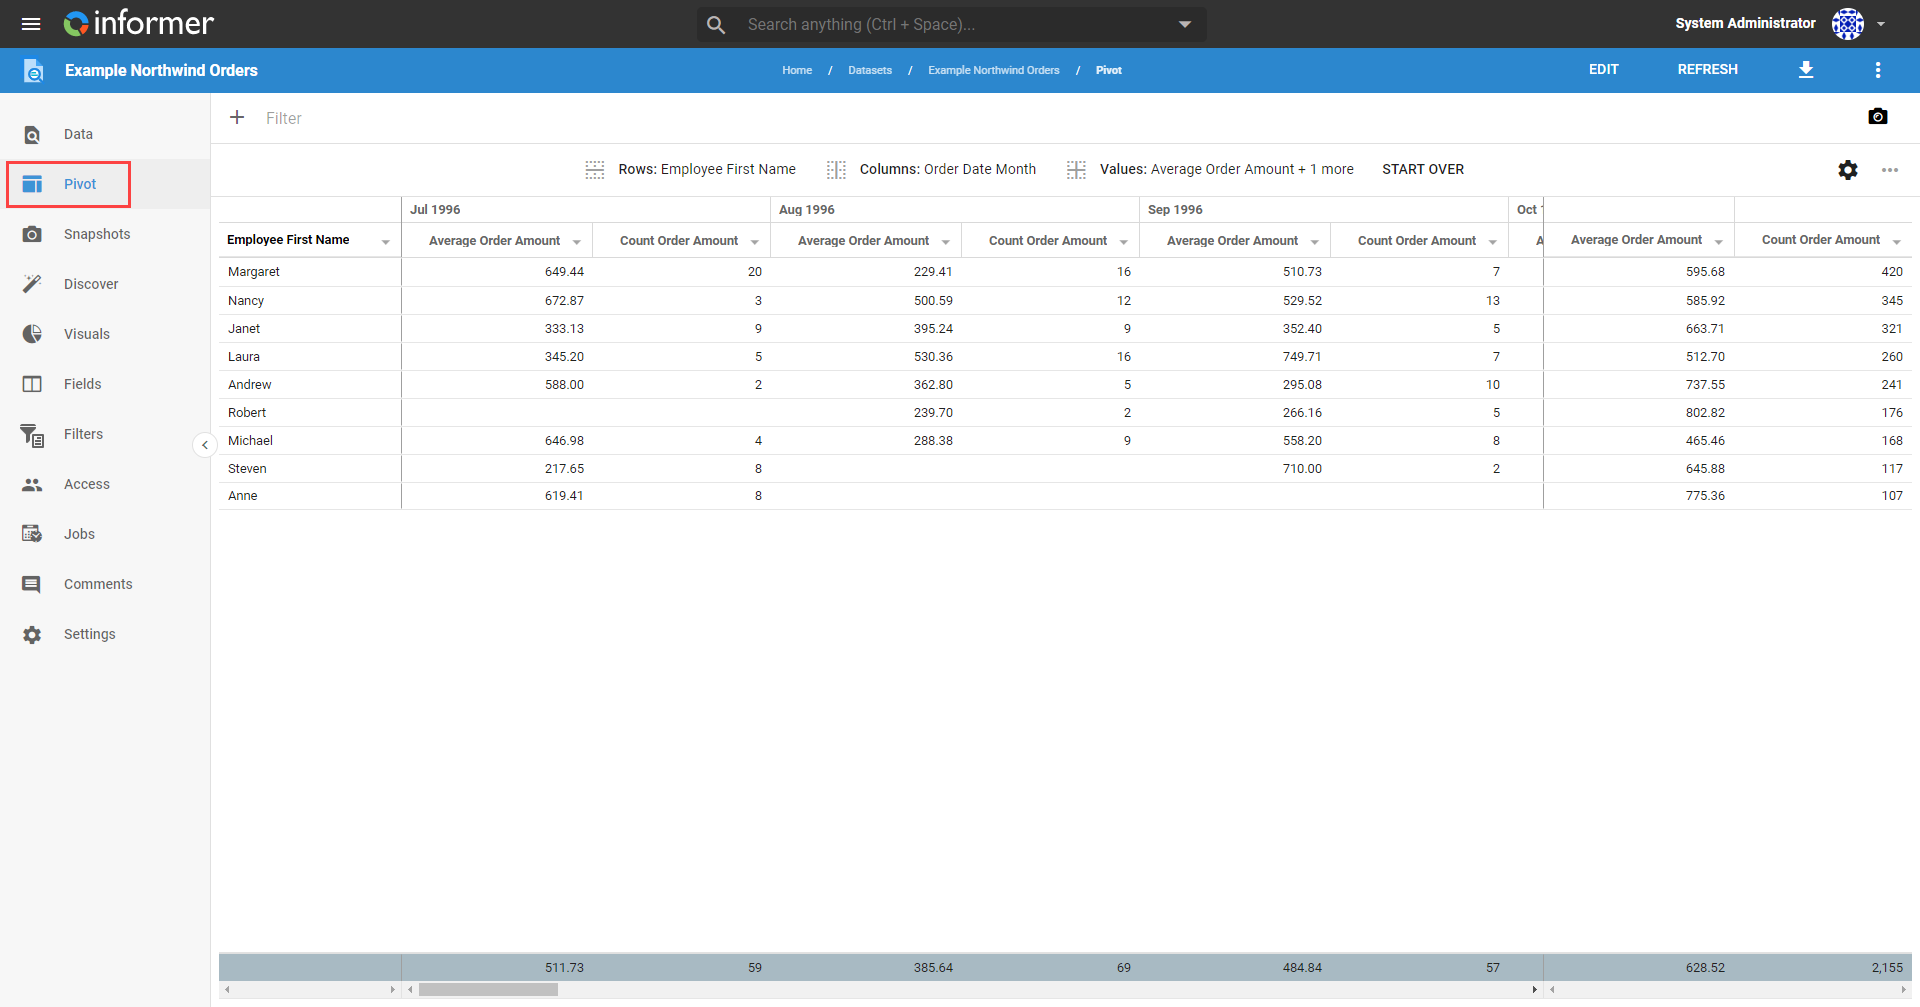
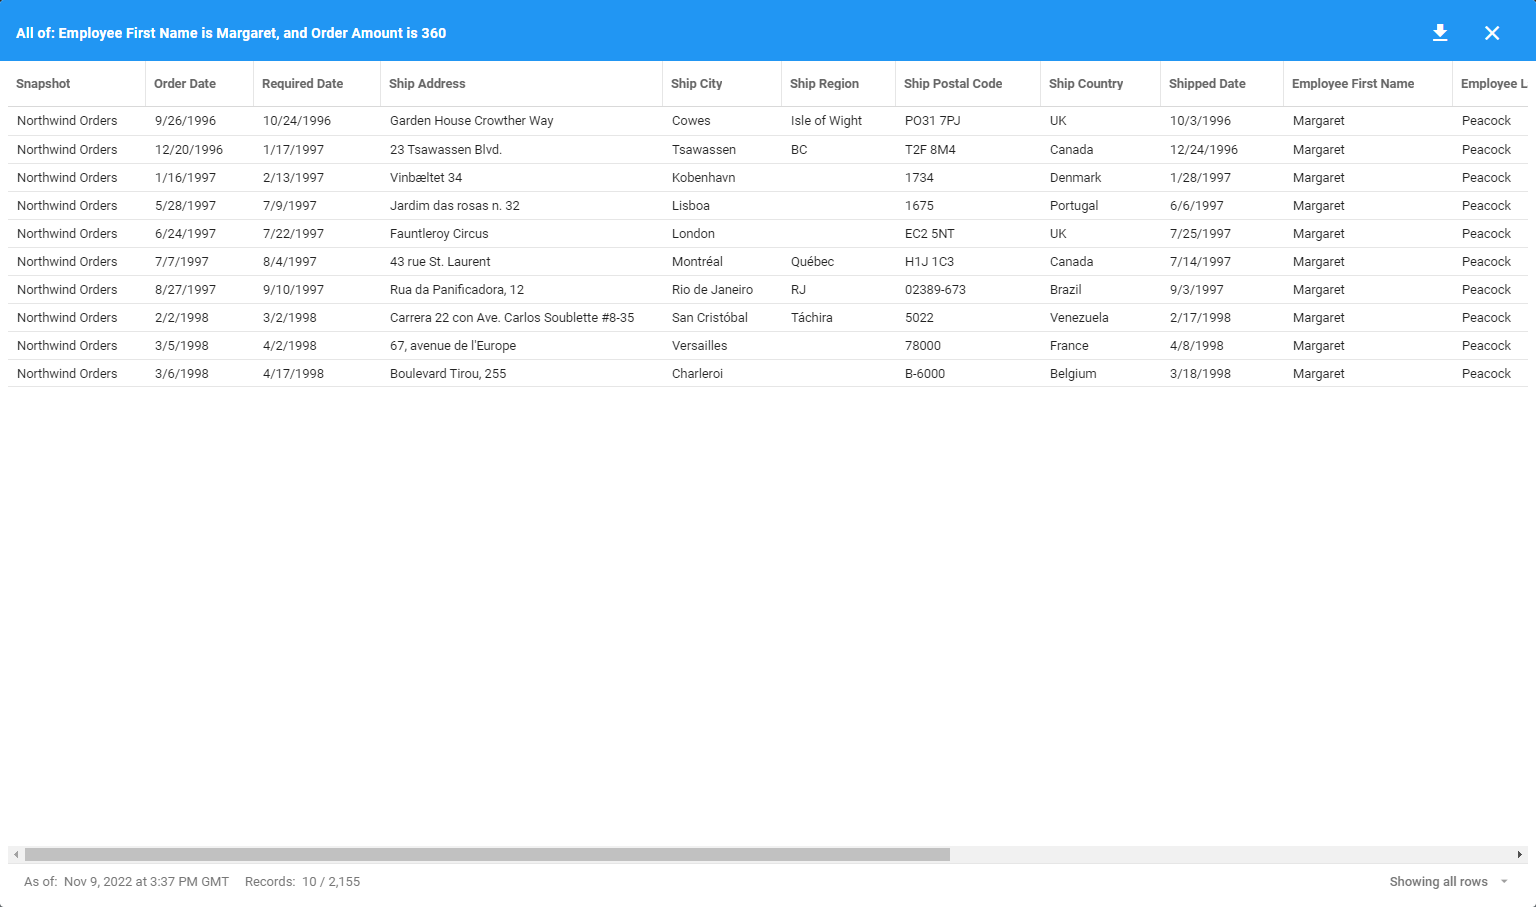
Pivot Tables support CSV data exports. They also support drilling down into an individual cell's data by clicking it to open a new Data Grid panel that shows only the drilled-down data. This subset of information can also be exported out of the system.
Also available through the REST API
Everything on this page is built on Informer's public REST API, the same one the product uses, so your scripts and integrations can do it too. Developer reference: Datasets.