How to use Discover mode
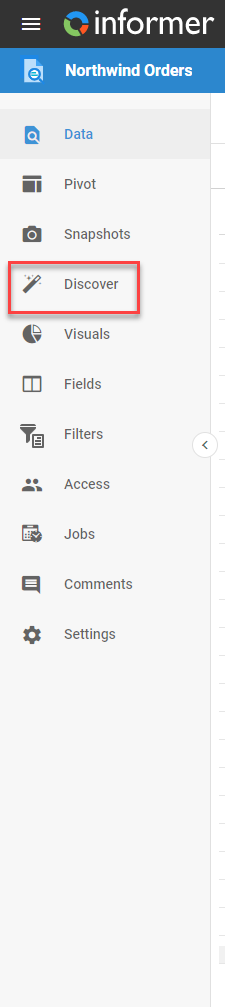
To create a Visual using Discover mode, go to the Dataset listing page and open a Dataset. Click the Discover icon in the left panel to open the Discover screen.
To begin making Visuals, select one or more Fields in the right panel. The center panel shows several types of Visuals based on the Fields chosen. Visuals with multiple groups, such as charts and tables, create groupings in the order the Fields were selected. To remove Fields, uncheck the boxes next to them, or click Start Over to clear the screen and begin again.
Visual options
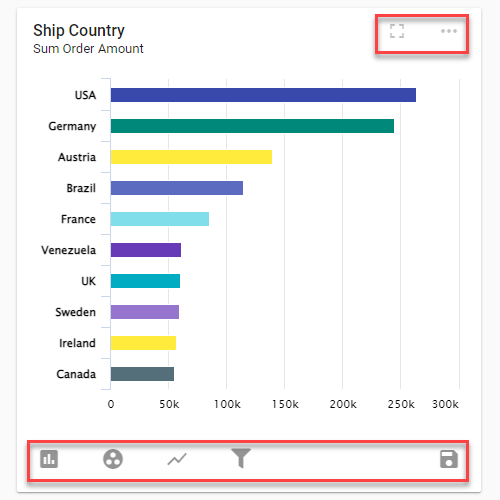
Each Visual generated by Discover can be customized using the icons at the top and bottom.
Expand
Click the Expand icon in the top-right corner to show a larger view of the Visual.
Actions menu
The Actions icon in the top-right corner opens a menu with additional options:
- Download: saves a local copy of the Visual as an image or HTML file to use outside Informer 5.
- Configure: changes the configuration of the Visual. For the configuration options of each kind of Visual, see Types of Visuals.
- Add copy to Homepage: pins a copy of the Visual to the Homepage with its current configuration. Later changes to the Visual do not affect the pinned version.
- Edit Name/Description: renames the Visual.
- Revert: reverts any changes made to the Visual's configuration since Discover generated it.
- Information: shows the last time the data used in the Visual was updated.
Common configuration options
Many Visuals have icons in the bottom-left corner for changing common configuration settings, such as grouping the data by different columns or changing the type of chart. This is a quick way to change the view of the data.
Filter
Filters data for a specific Visual. To learn how to filter Visuals, see Filtering a Visual.
Save Visual
Saves the Visual to the Dataset's Saved Visuals. To navigate to Saved Visuals, click the Visuals icon in the left panel of the Dataset.