Working with Datasets
A DatasetA saved, queryable collection of data pulled from one or more Datasources. Datasets are the foundation for reports, dashboards, and AI data analysis. is a collection of data Informer pulls from a DatasourceA connection from Informer to a database or other system of record, such as PostgreSQL, SQL Server, or UniVerse., indexes, and keeps ready to explore. Once your data lives in a Dataset you can search it, filter it, pivot it, chart it, and hand it to a chat for analysis, all without querying the source system again.
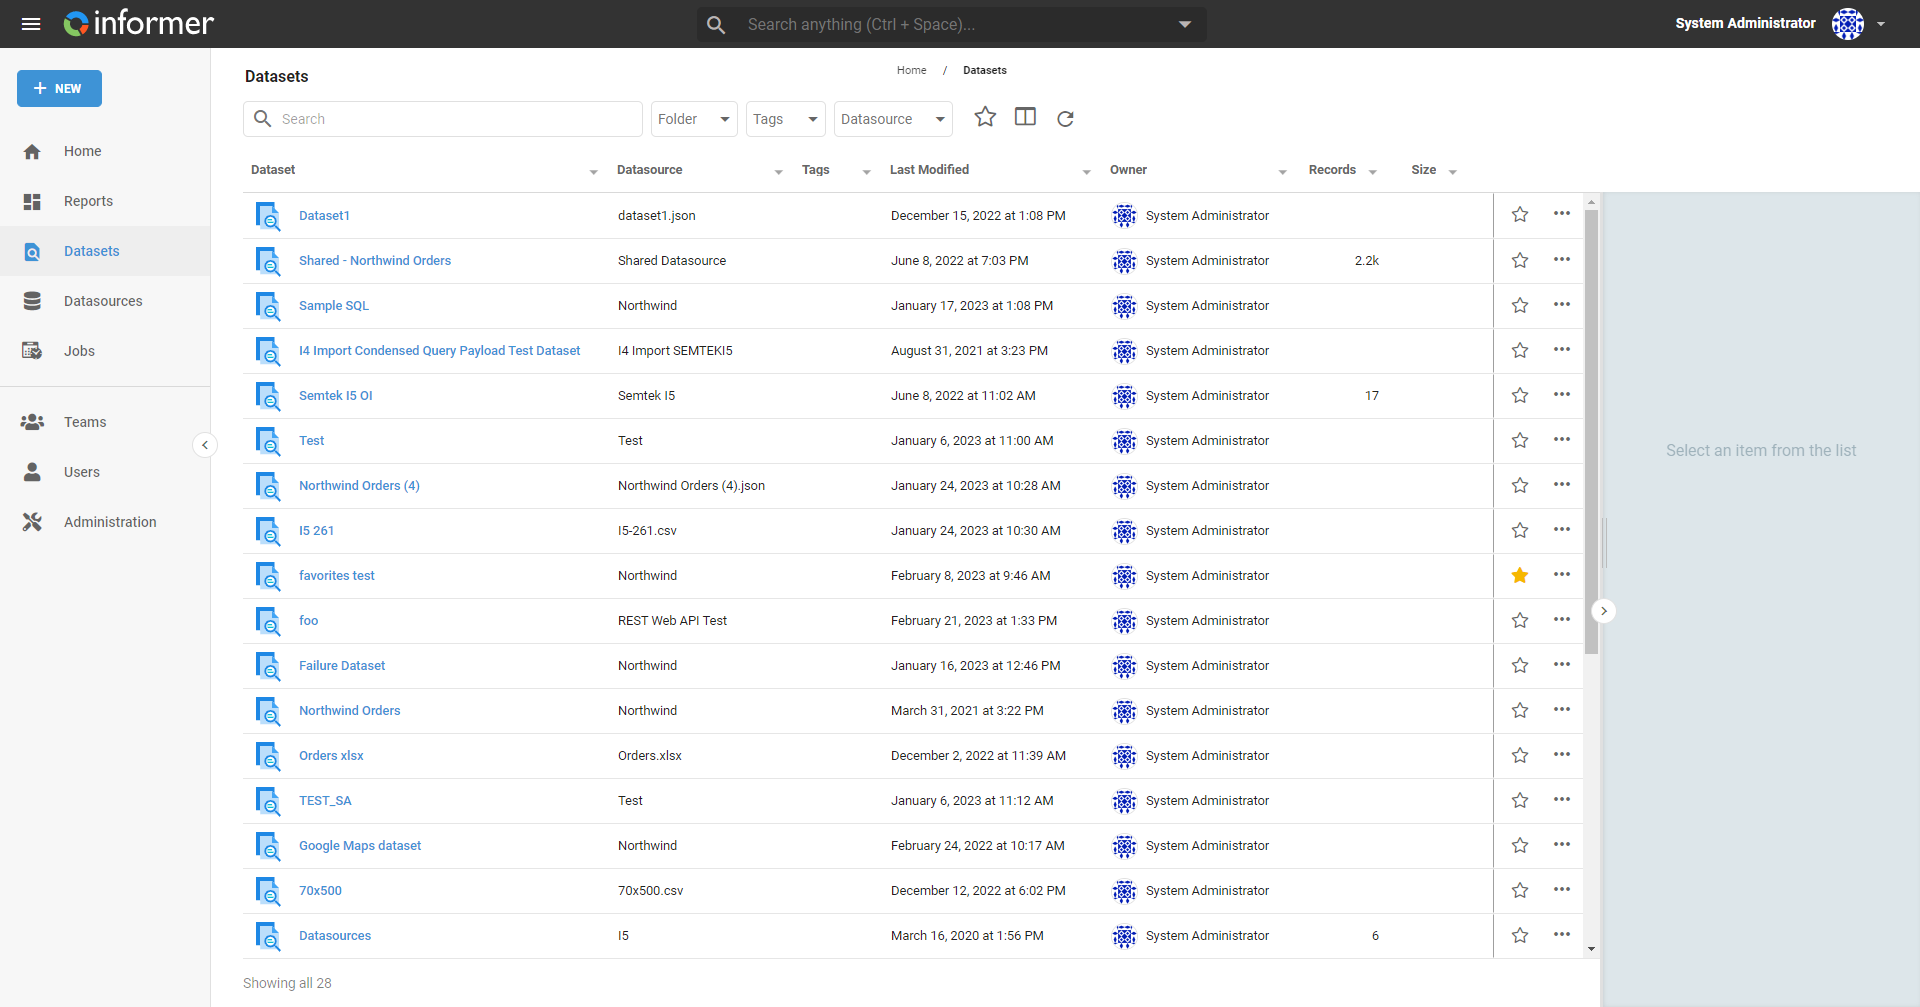
Why Datasets matter
Source systems are built to run a business, not to answer the same questions quickly and repeatedly. A Dataset is Informer's answer to that: it loads the records you care about, indexes them for fast search and aggregation, and becomes the foundation everything else reads from. Reports, Visuals, pivot tables, and AI analysis all build on Datasets, so the work you do here, naming Fields, setting access, choosing how the data refreshes, pays off everywhere that data is used.
The Dataset workspace
Open a Dataset and you get a workspace with a tab for each thing you can do with it:
| Tab | What it's for |
|---|---|
| Data | View and analyze your data |
| Fields | Add and manage existing Fields on the Dataset |
| Pivot | A pivot table for your data |
| Visuals | Your charts and other visualizations |
| Discover | A take on your data by Informer |
| Filters | Manage filters for this Dataset |
| Snapshots | View and analyze Snapshots of your data |
| Access | The owner and Teams that have access to this Dataset |
| Jobs | Jobs that access or refresh the Dataset and perform actions |
| Comments | Discussion regarding the Dataset |
| Settings | Configure the settings of the Dataset |
In this section
| Chapter | In one line |
|---|---|
| Overview | The listing page and the ways to create a Dataset. |
| Pivot Tables | Summarize a Dataset into a rows-by-columns cross-tab. |
| Discover | Auto-generated Visuals from a quick selection of Fields. |
| Visuals | The charts, KPIs, tables, and maps you build from a Dataset. |
| Fields | The Fields panel, inherited security, and the four kinds of Script Field. |
| Access | Ownership, sharing, row- and Field-level security, and role breakdown. |
| Settings | Refresh behavior: timestamp Fields, update modes, and index names. |
| Appendix | Snapshots and reporting on audit logs. |
Where do I look when...
| You want to... | Where |
|---|---|
| Build a new Dataset | Creating a Dataset |
| Add a calculated or script value | Dataset and Script Fields |
| Turn your data into a chart | Visuals |
| Let Informer suggest charts for you | Discover |
| Reshape data into a cross-tab | Pivot Tables |
| Control who can see the data or its Fields | Access |
| Change how and when the data refreshes | Refresh behavior |
| Keep point-in-time copies of the data | Snapshots |