Creating a Data View
A Data View is a single Dataset driving a single row-and-column grid and a single Pivot Table, providing record-level detail in a familiar spreadsheet-style format.
Creating a Data View
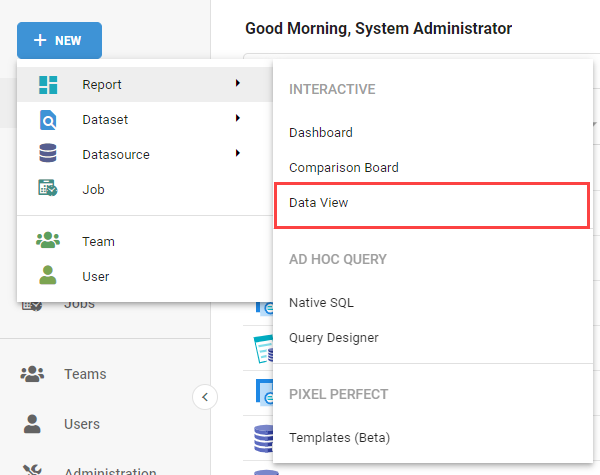
Create a Data View by clicking the + New button in the upper-left of Informer, hovering over Reports, and selecting Data View under the Interactive heading.
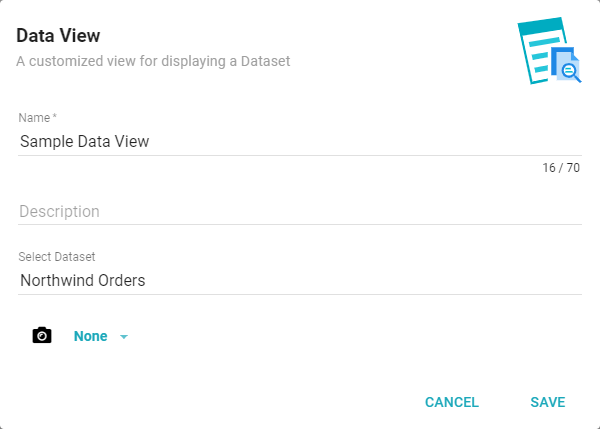
A dialog opens. Enter a name and optional description, select a Dataset or Snapshot to build from, then click Save.
Adding Fields
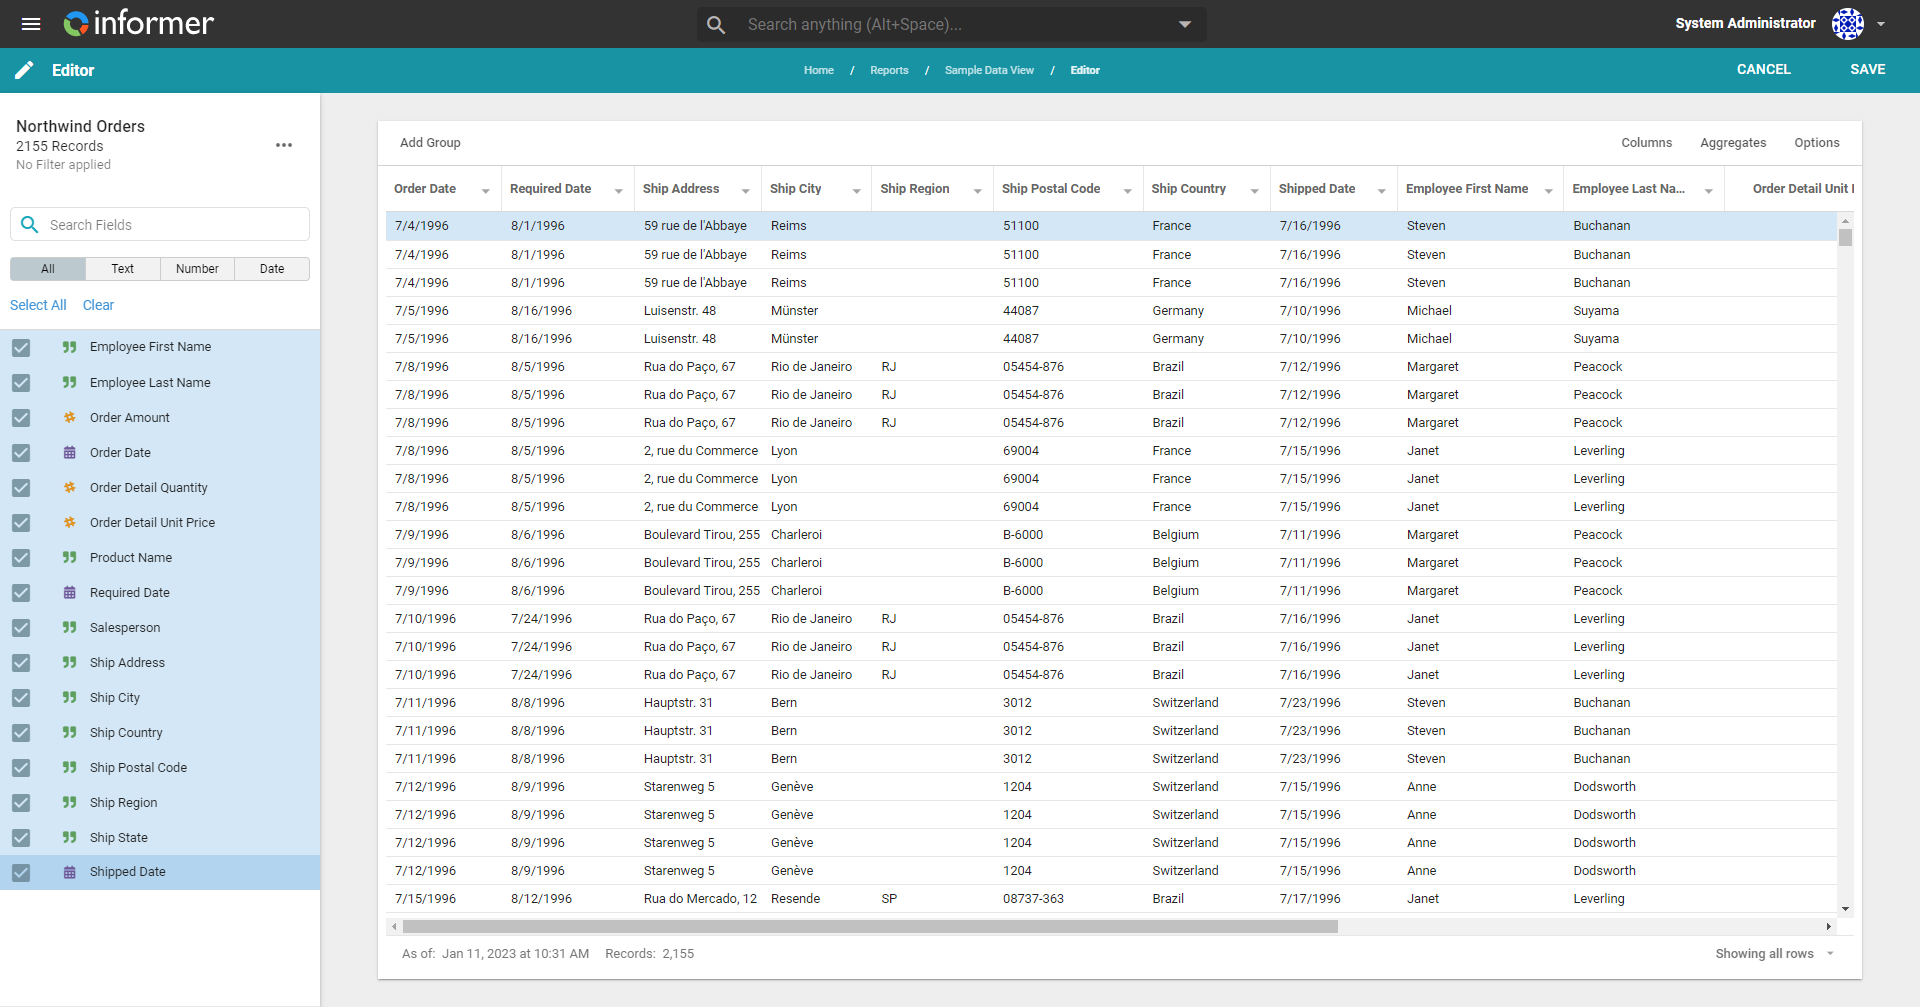
After clicking Save, Informer opens the Data View editor. Add Fields by checking boxes in the left panel, or click Select All to add every Field in the Dataset. Remove a Field by unchecking its box, or click Clear to remove all Fields. The order of selection determines the order of the Fields in the Data View. All of the standard view options are available for Fields added to the Data View. See Field options while viewing.
Options
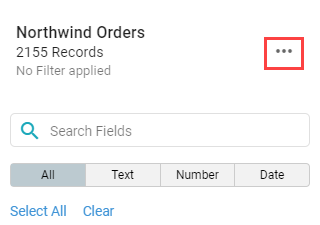
Click the ... button in the top-right corner of the left panel to show the Data View actions.
- Edit Dataset: change the Label, Alias, or Snapshot of the underlying Dataset.
- Saved Filters: apply one of the Dataset's saved Filters, if any are available.
- Custom Filter: create a new Filter to apply to the Dataset. See Creating a simple Filter.
- Refresh: update the data in the Dataset.
- Remove: remove the Dataset from the Report.