What is a Data View?
A Data View is a row-and-column grid sourced from a single Dataset. Data Views provide record-level detail in a familiar spreadsheet-style format, allowing on-the-fly groups, sorts, aggregates, formatting, and Pivot Tables.
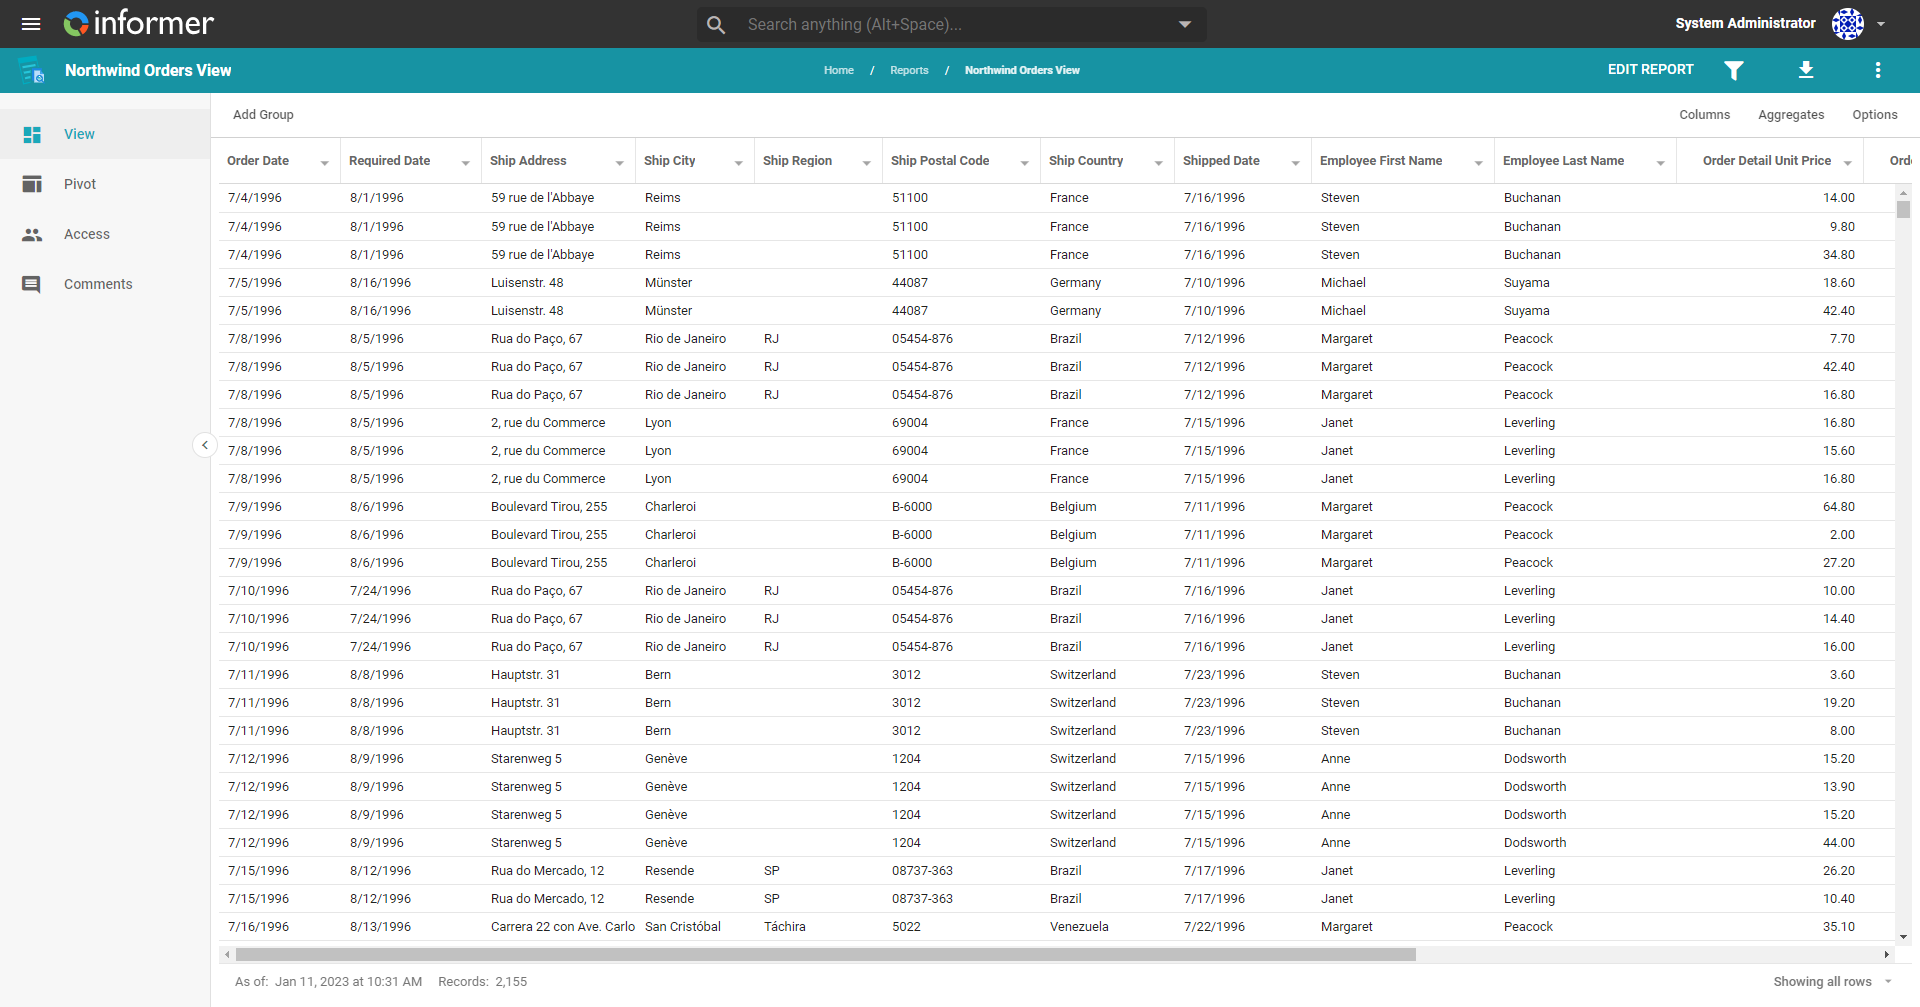
A Data View consists of a set of columns and rows for standard display, and a Pivot Table for analytics. In the default view, columns are available for formatting, reordering, and pinning. Pinning keeps columns in place when scrolling, grouping, sorting, and hiding or unhiding columns. The Pivot view provides the same functionality as the Pivot Table Visual: use it to create cross-tab summary data, including aggregates and drill-down details.
A Data View is a single Dataset driving a single grid and a single Pivot Table. Data View users do not have direct access to the Dataset driving it; they only access the resulting grid and Pivot Table. Customize the Data View further by creating optional hard Filters for the Dataset and then selecting the Fields for column display. Each column provides formatting options based on its data type. Organize the Data View using custom User Settings to best fit the use case. The default structure of the Data View is the one created by the author: any pinning, grouping, or other manipulation applied in Edit mode becomes the base structure for the Data View.