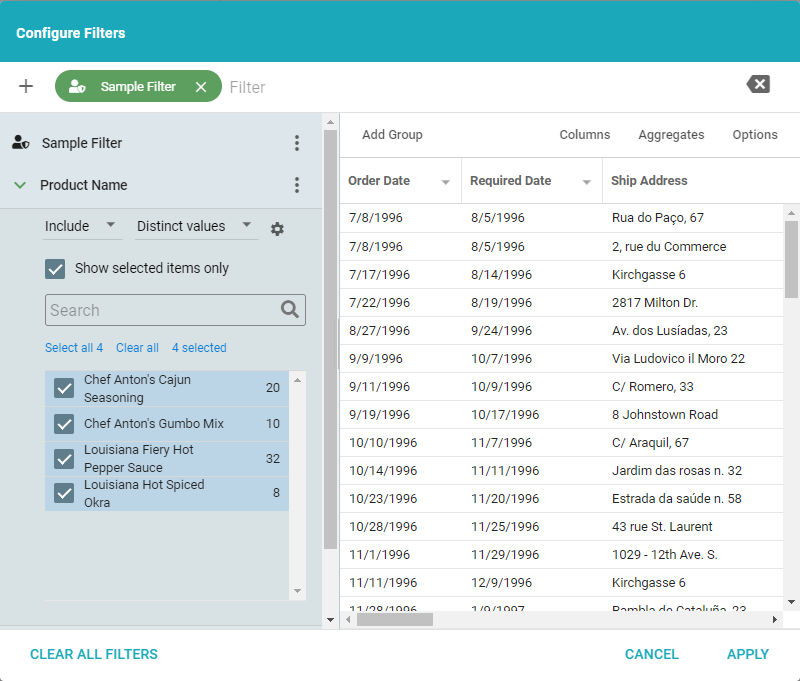
What is a Dashboard?
A Dashboard is a collection of Visuals, sourced from one or more Datasets, on a canvas. A Dashboard typically collects Visuals of a similar concern, such as Year over Year Product Sales. These Visuals provide interactive metrics measured against Key Performance Indicators. You customize the Dashboard's look by dragging, dropping, and resizing Visuals to create the desired layout.
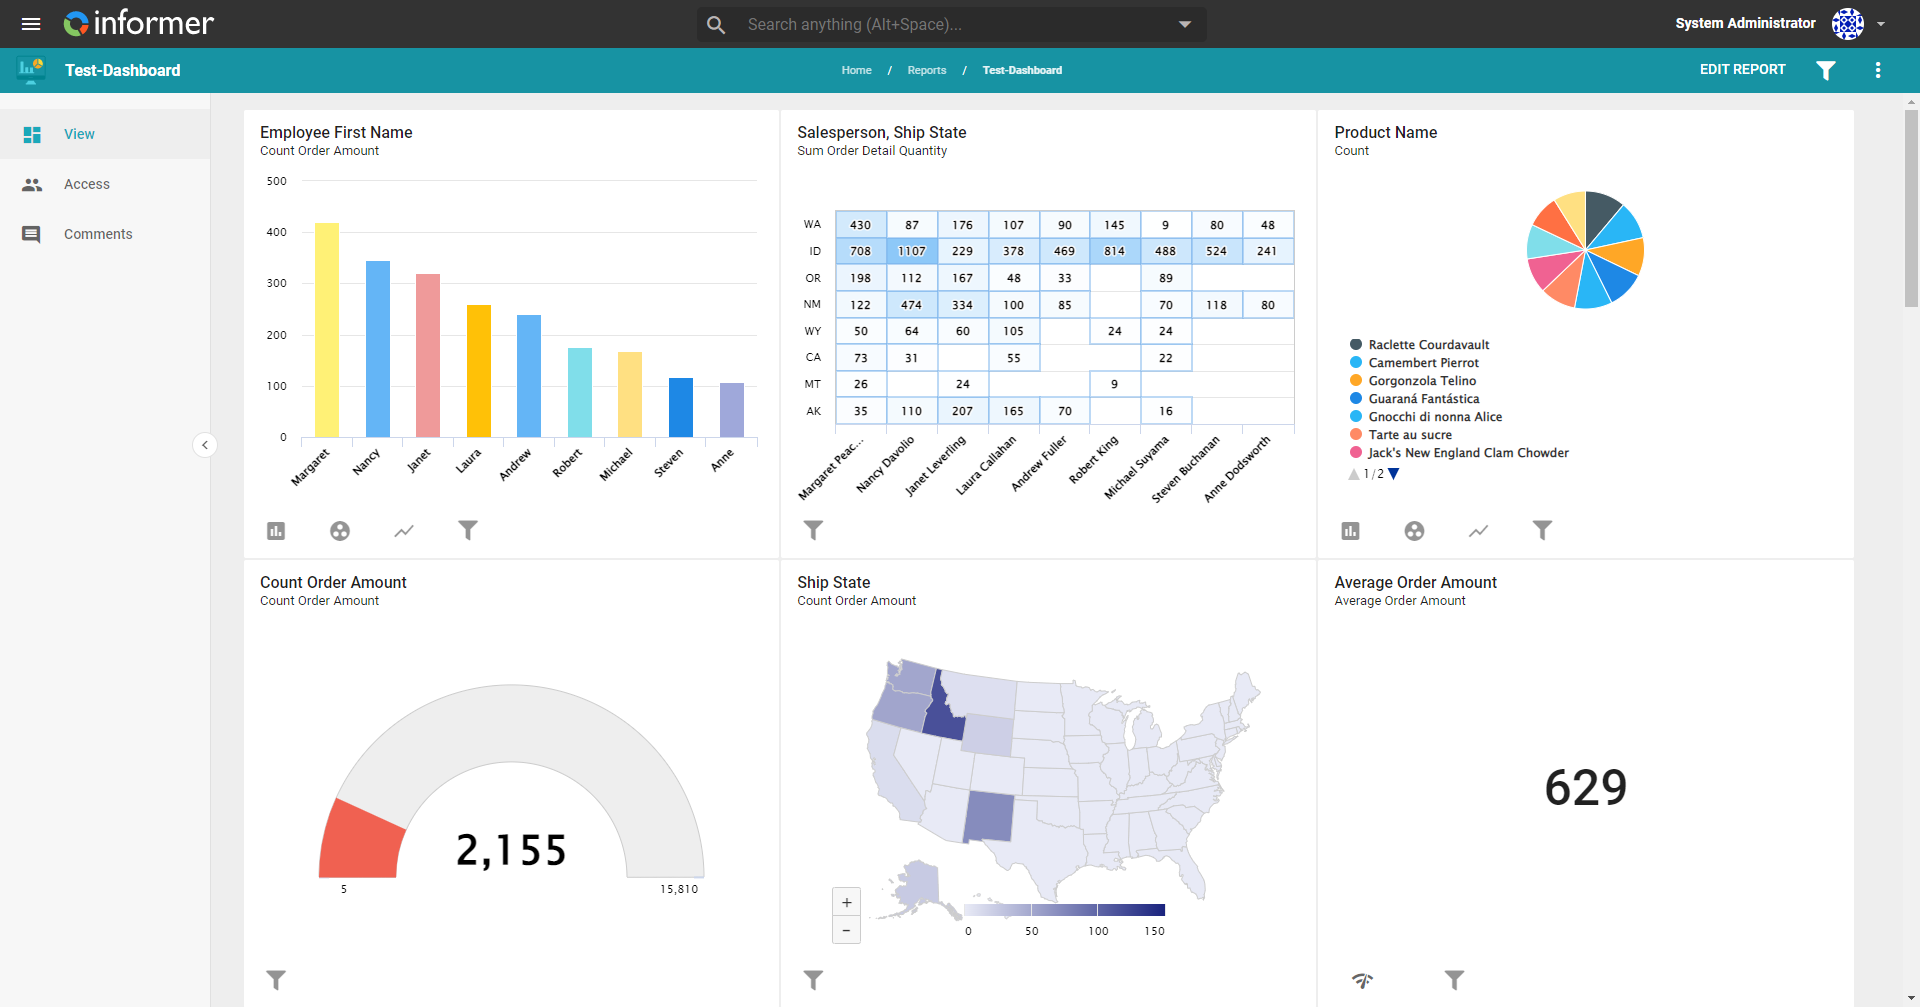
For example, a large map of sales orders showing strong and weak markets for potential growth, with supporting Visuals underneath, may be appropriate. The design and layout of a Dashboard is customizable to fit any business need.
Visual types control their own drilldown strategy. Consumers of Dashboards do not have access to the Datasets used to create them, except to the extent that a particular Visual drilldown provides. Individual Visuals on the Dashboard are also interactive, using the familiar Filtering options that are standard throughout Informer.