What is a Comparison Board?
A Comparison Board allows quick comparative analysis of data in a side-by-side Visual layout. It is a collection of Visuals, sourced from one or more Datasets, selected to compare segments of data against each other or against the whole Board. A Comparison Board typically collects Visuals of easily segmented data in a vertically organized, side-by-side display, such as Year over Year Sales by Salesperson, letting Users split the data among axes.
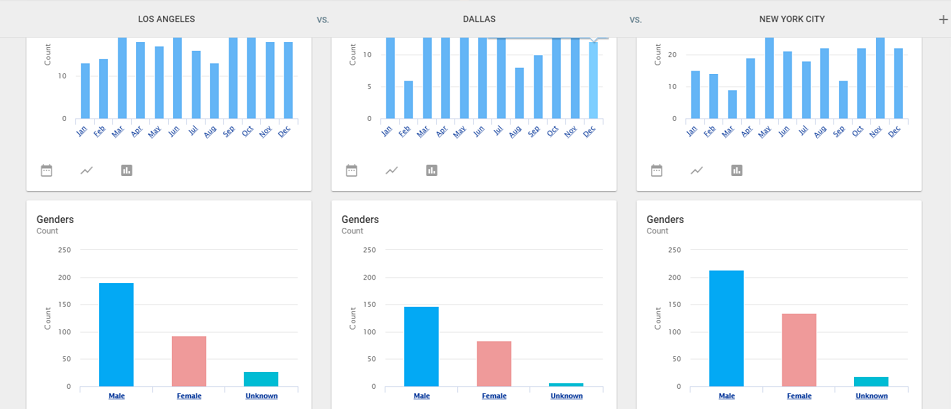
Use Comparison Boards to split the data vertically at least once, and potentially any number of times, once for each dimension. At the very top of the board is a Global Comparison, against which each split filters. To change the default Comparison view created by the Report author, click the Comparison header and choose a Field from one of the Datasets. Select a Filter for each split, and the Visuals automatically provide a comparison platform. The last dimension in order defaults to Everything Else, representing all records except those contained in the other filtered splits. To add a new comparison column, create a new split.
Visuals are only stackable vertically within splits, and the Visual positioning applies to each split in the Comparison Board. Comparison Board users do not have direct access to the Datasets driving a Comparison Board: they only access the resulting Visuals.