Creating a Comparison Board
A Comparison Board allows quick comparative analysis of data in a side-by-side Visual layout, sourced from one or more Datasets.
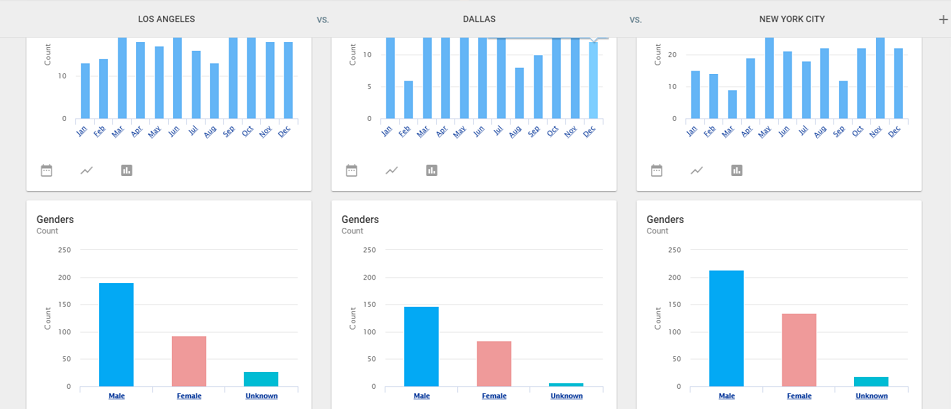
Configuring a Comparison Board
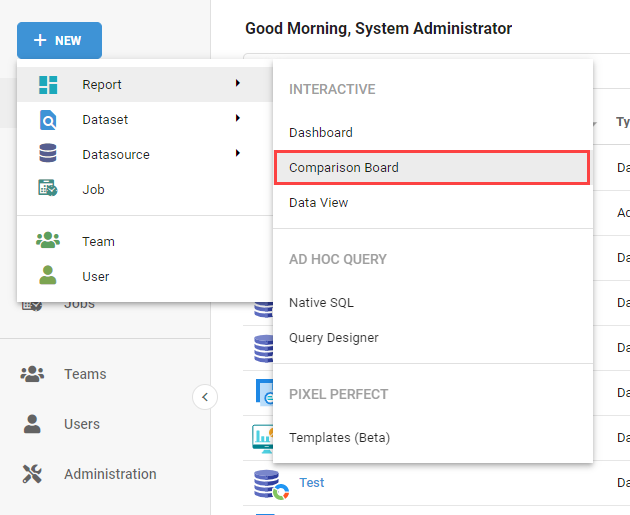
Create a Comparison Board by clicking the + New button in the upper-left corner of Informer, hovering over Reports, and selecting Comparison Board under the Interactive heading.
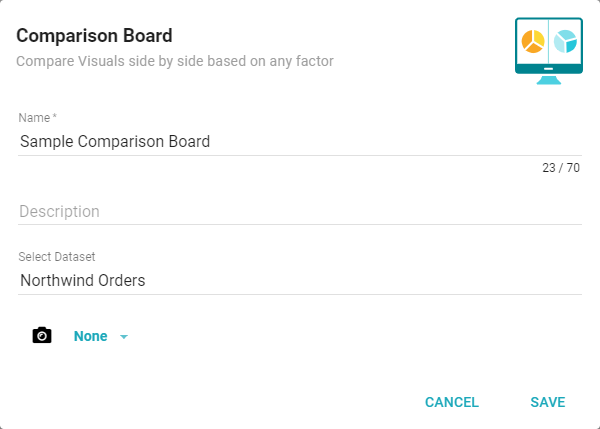
A dialog opens. Enter a name and optional description, select a Dataset or Snapshot to build from, then click Save.
Build Visuals from any of the Datasets added to the Comparison Board. The Datasets menu in the top-left lists all the Datasets that are part of the Board. Click Add Dataset to add a new Dataset. Click any Dataset in this menu to see the options for changing it.
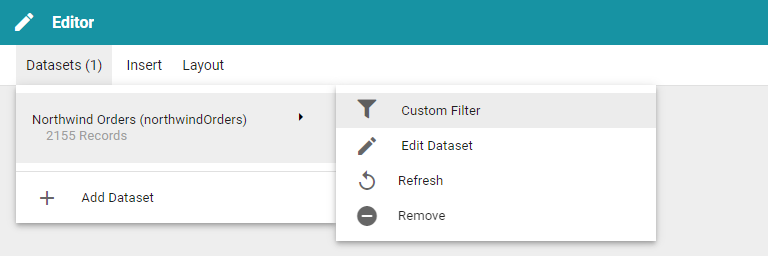
- Saved Filters: apply one of the Dataset's Saved Filters.
- Custom filter: create a new Filter to apply to the Dataset.
- Refresh: update the data in the Dataset.
- Remove: remove the selected Dataset from the Board. Any Visuals using the Dataset stop working until it is re-added.
Inserting Visuals
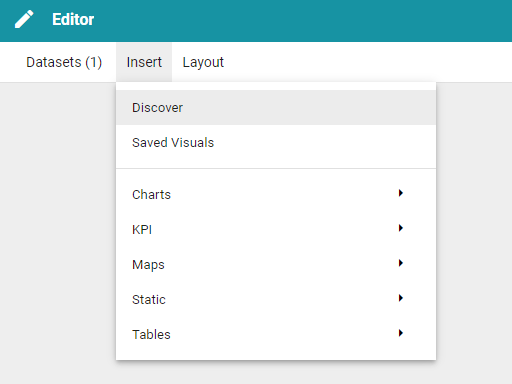
Use the Insert menu to add new Visuals to the Comparison Board. The options are Discover, Saved Visuals, or creating a new Visual.
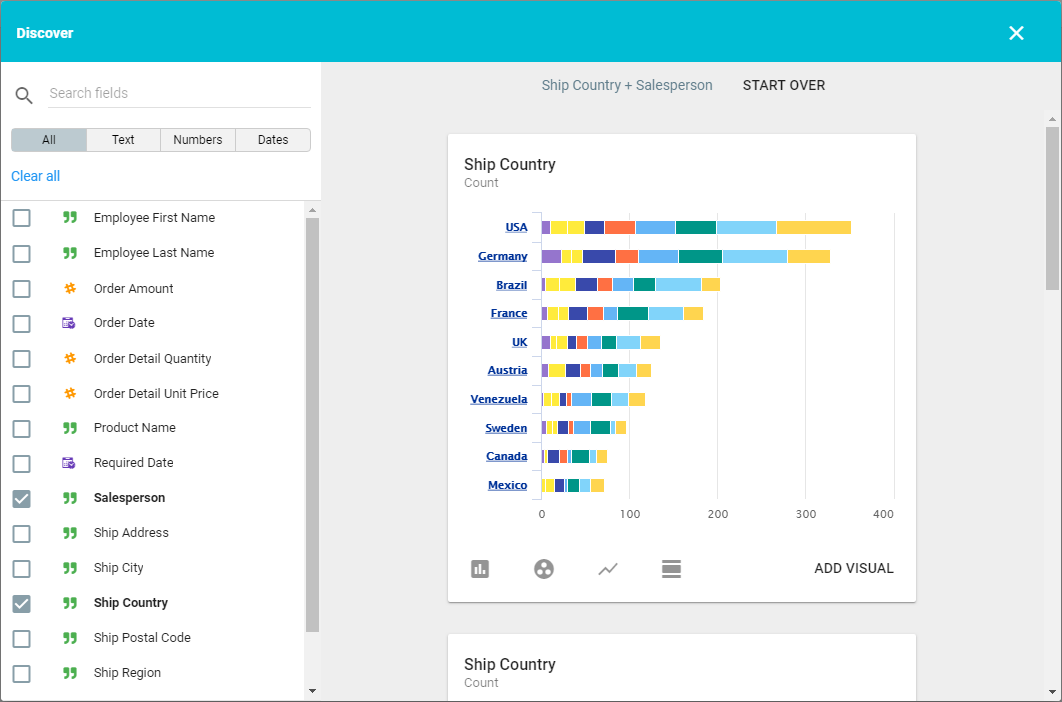
Discover
To create a Visual using Discover, select Discover from the Insert menu. Check the boxes next to the Fields in the left panel to generate Visuals for them. Scroll the list on the right to find one, then click Add Visual in the bottom-right corner. Click the X in the top-right to return to the Report. For more, see How to use Discovery Mode.
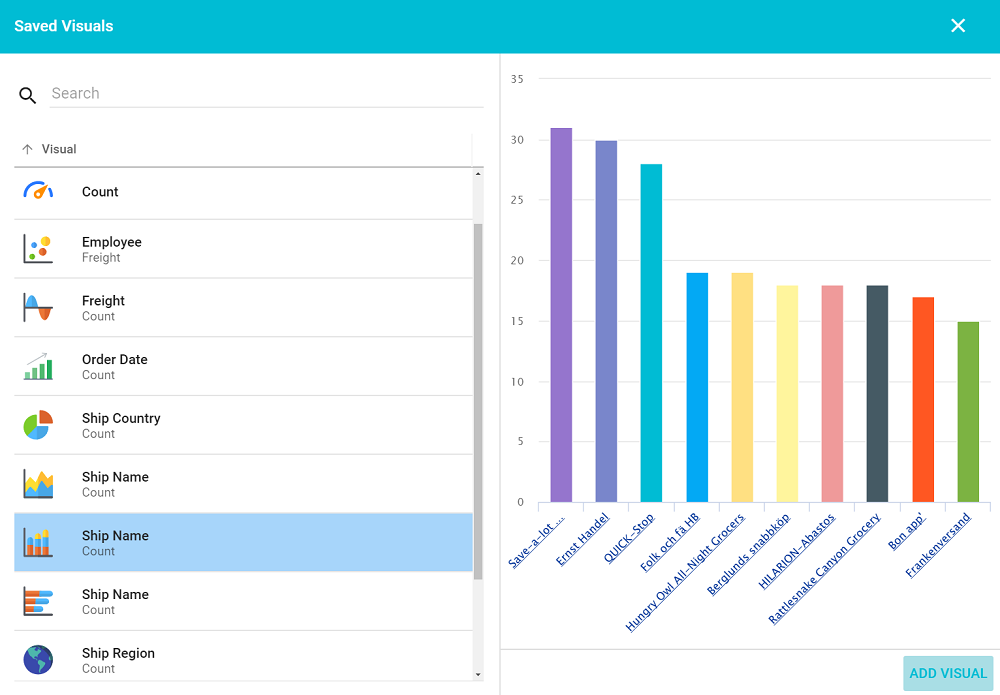
Saved Visuals
To add a saved Visual, select Saved Visuals from the Insert menu, choose the Dataset that contains the Visual (if there is more than one), then choose the Visual from the list. A preview displays in the right panel. Click Add Visual to add it, then click the X to close the window.
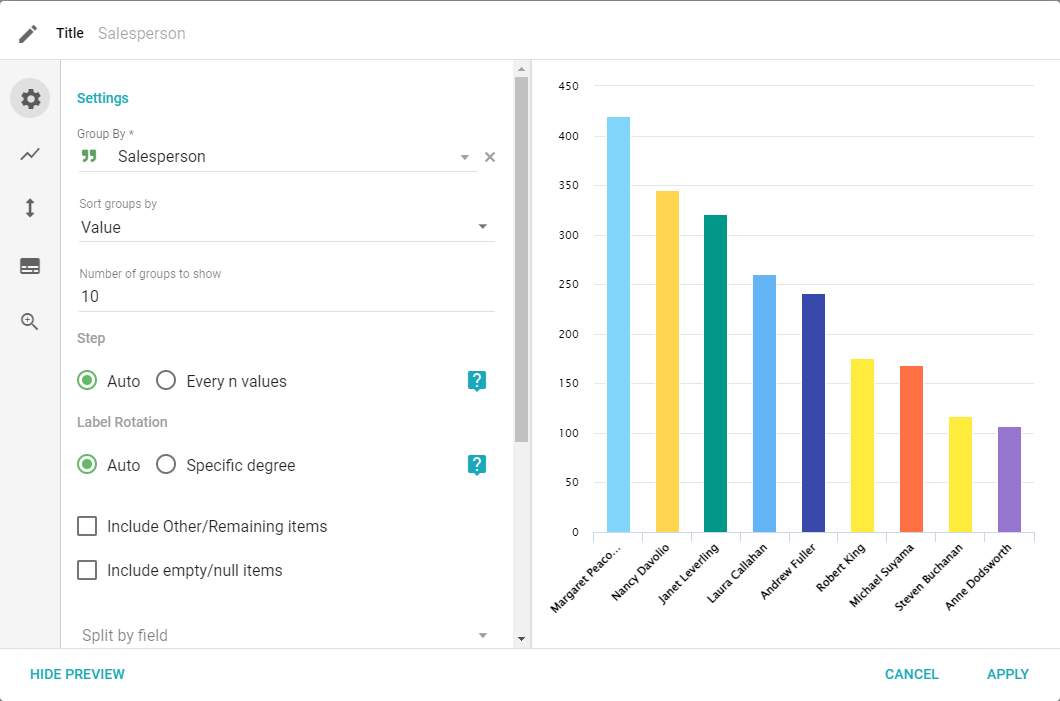
New Visual
To create a new Visual, open the Insert menu and select the type of Visual in the sub-menu. Choose the settings, then click Save. For more on configuring different Visual types, see Visual Configurations.
Layout
The Layout menu gives access to organization features for the Comparison Board.
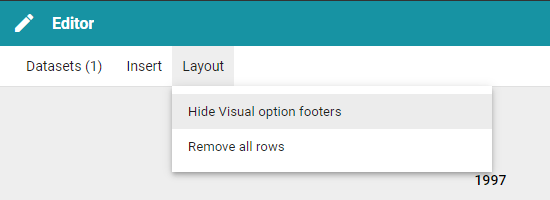
At the bottom of most Visuals are top-level options to reconfigure the Visual and a button to move the row to a new location. The options depend on the type of Visual; for a full list, see Visual Configurations. The Show/Hide Visual Options layout option hides or shows this row for each Visual, and Remove all rows removes all Visuals from the Board.
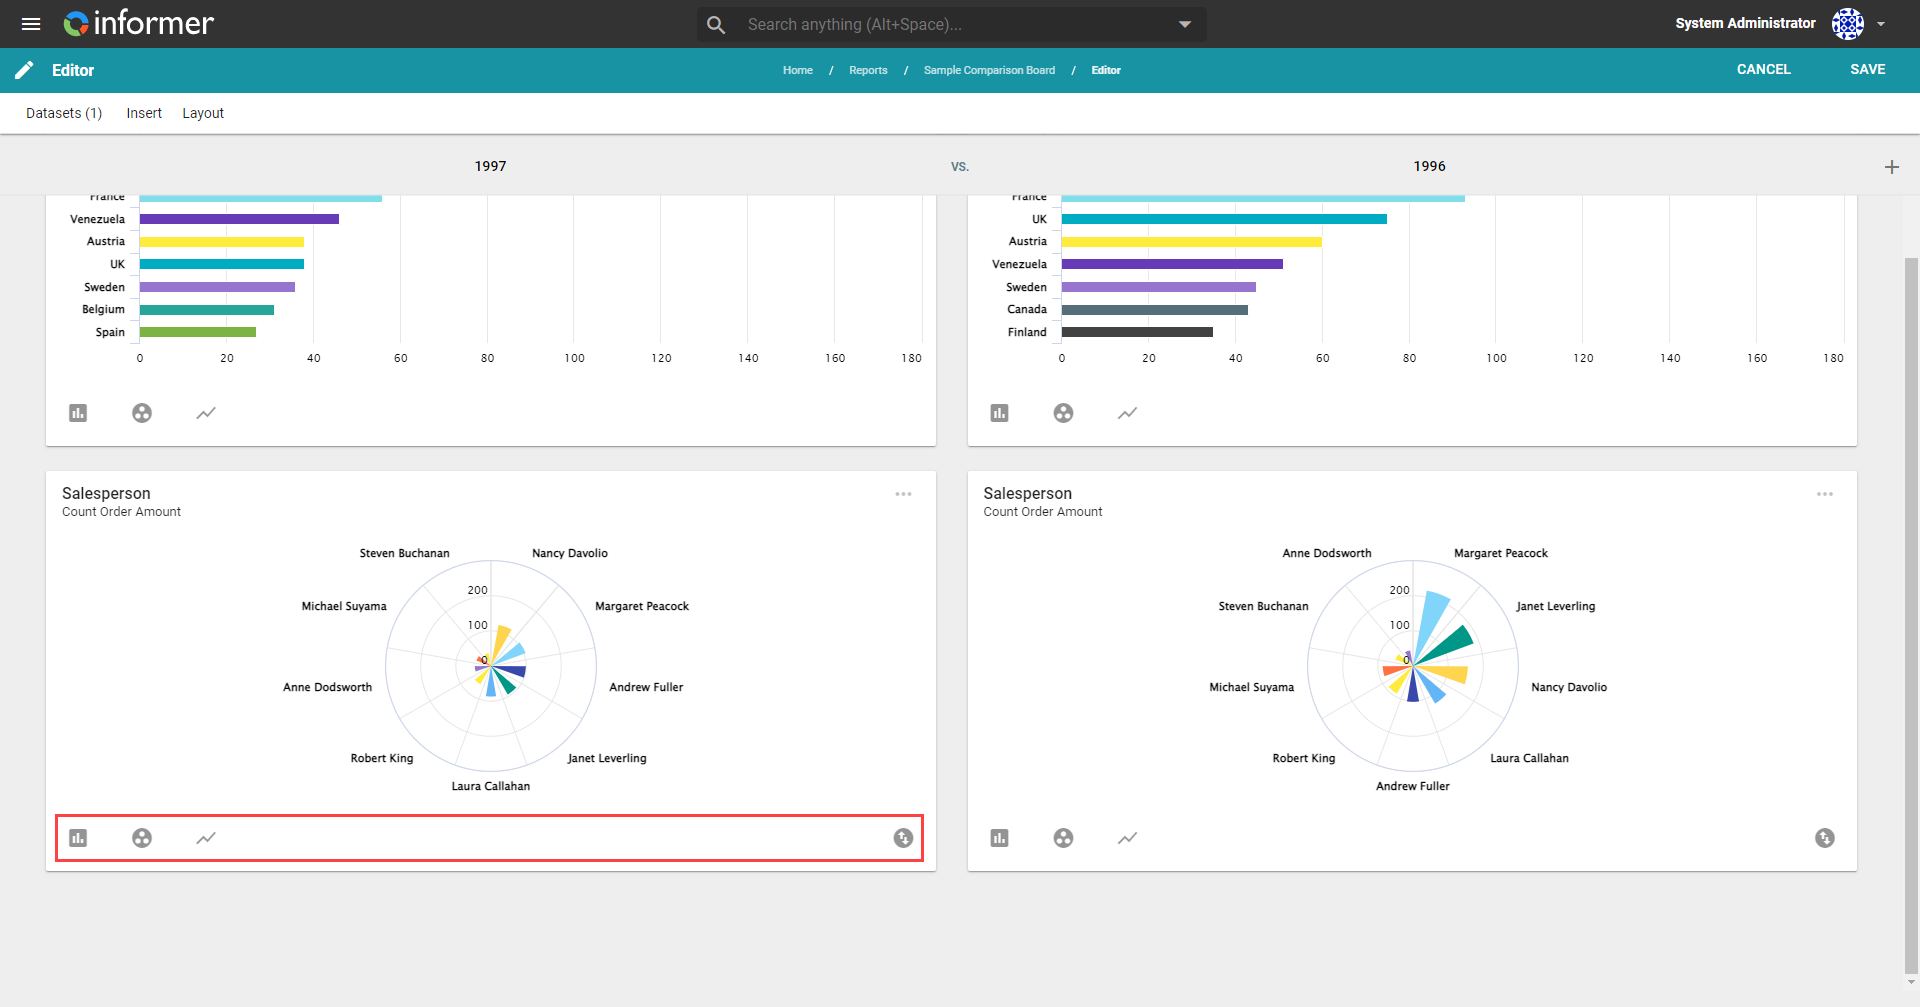
After hiding the Visual Options, configure Visuals by clicking the Actions menu in the top-right corner of the Visual and selecting Configure.
Select Comparison
The main draw of Comparison Boards is comparing Visuals side by side, each configured with different Filters. To configure a comparison, click Select comparison at the top of the Comparison Board configuration window. The menu shows a list of Datasets in the Board and the Fields in each.
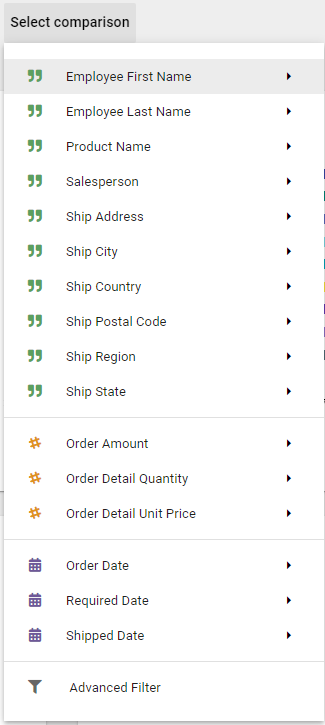
Select a Field and a type of comparison to differentiate the side-by-side Visuals. This splits the Board into two columns: the first represents a selected value, and the second represents Everything else. Click Select values at the top of a column to choose the specific value the column represents.
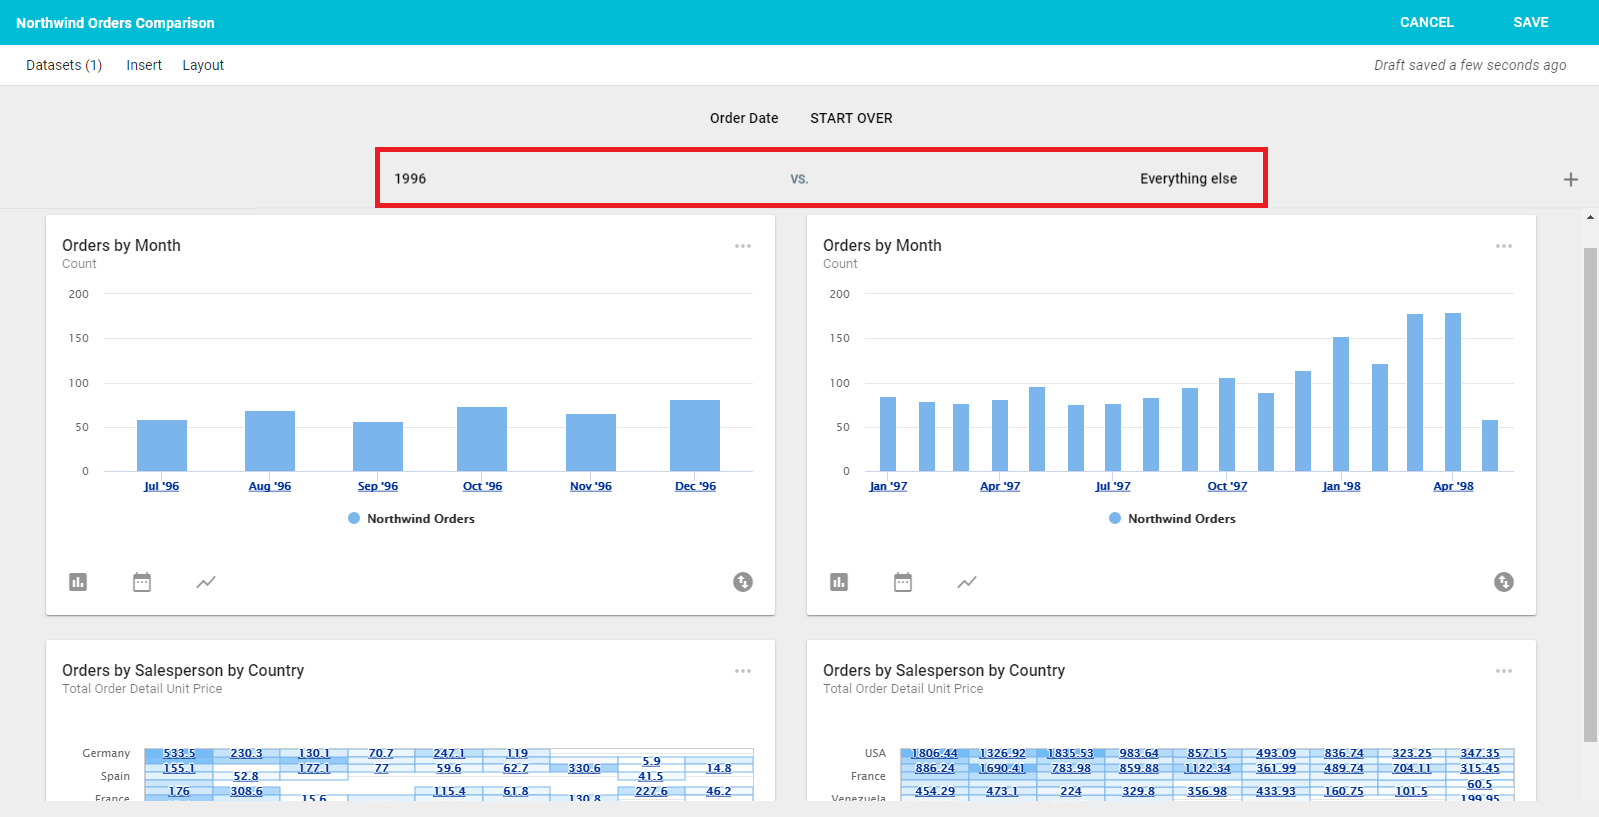
Change what the second column represents by clicking Everything else and configuring it for a specific value (for example, a second column for 1997 instead of everything else).
Add a new column with a new comparison by clicking the + button to the right of the column headers. This adds a new Everything Else column without a specific value set.
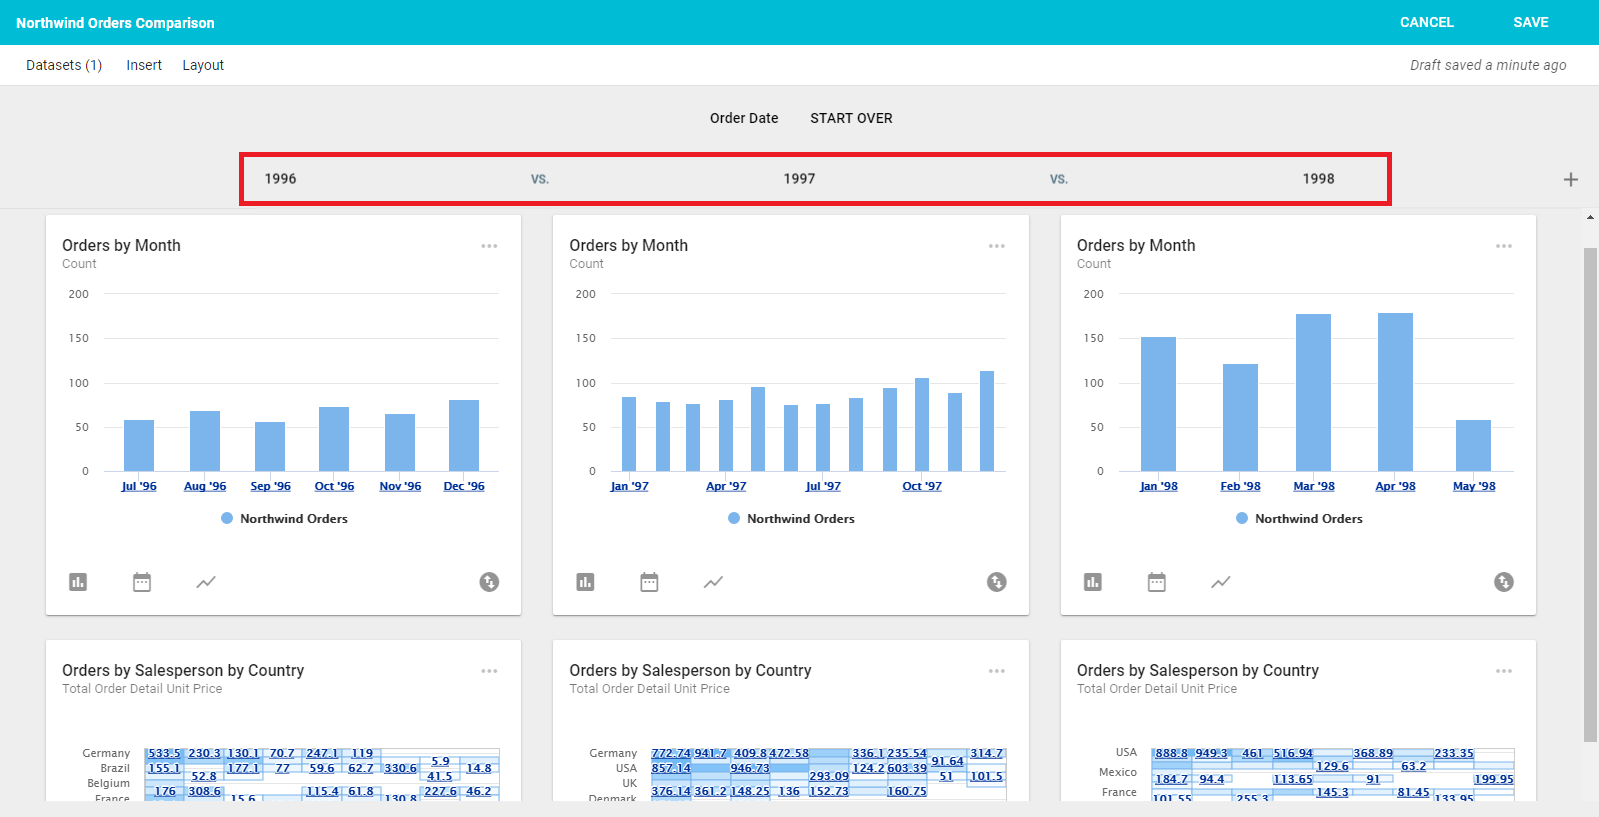
Remove the configured comparison and any additional columns by clicking Start Over.