Field options while viewing
Field options change how Fields display in a Query's result set. Any changes you make on the Data page become part of your custom user settings for that Query, so the appearance is kept the next time you view it.
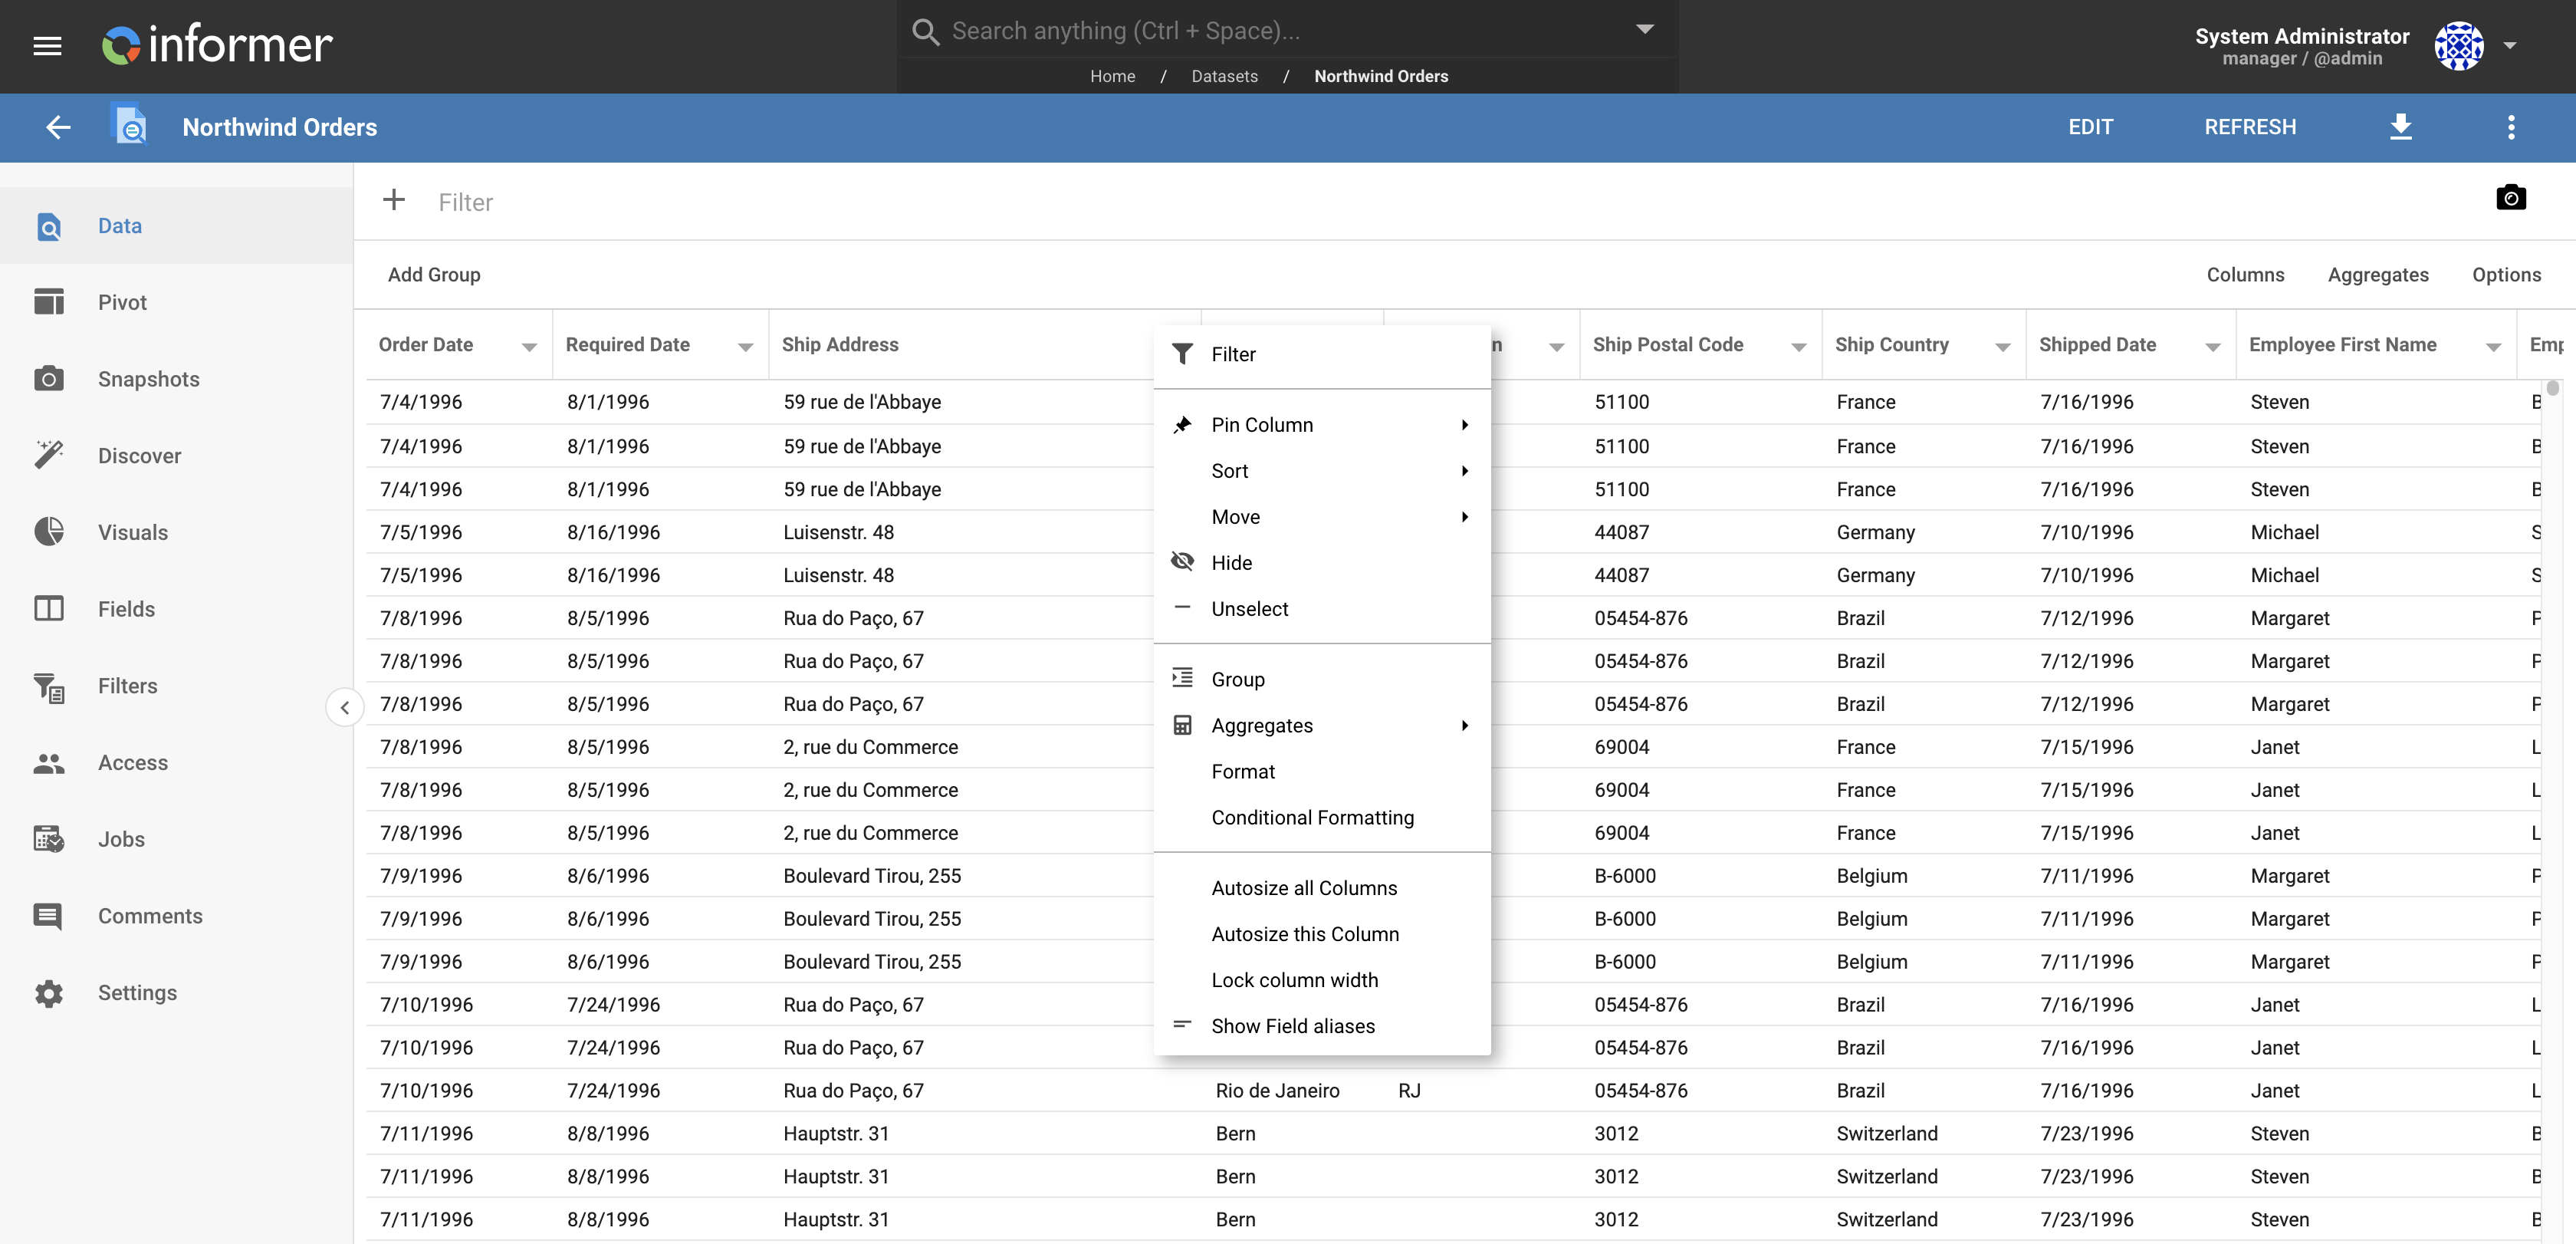
To view a Field's options, open the Query and click the down arrow next to a Field's name.
Filter
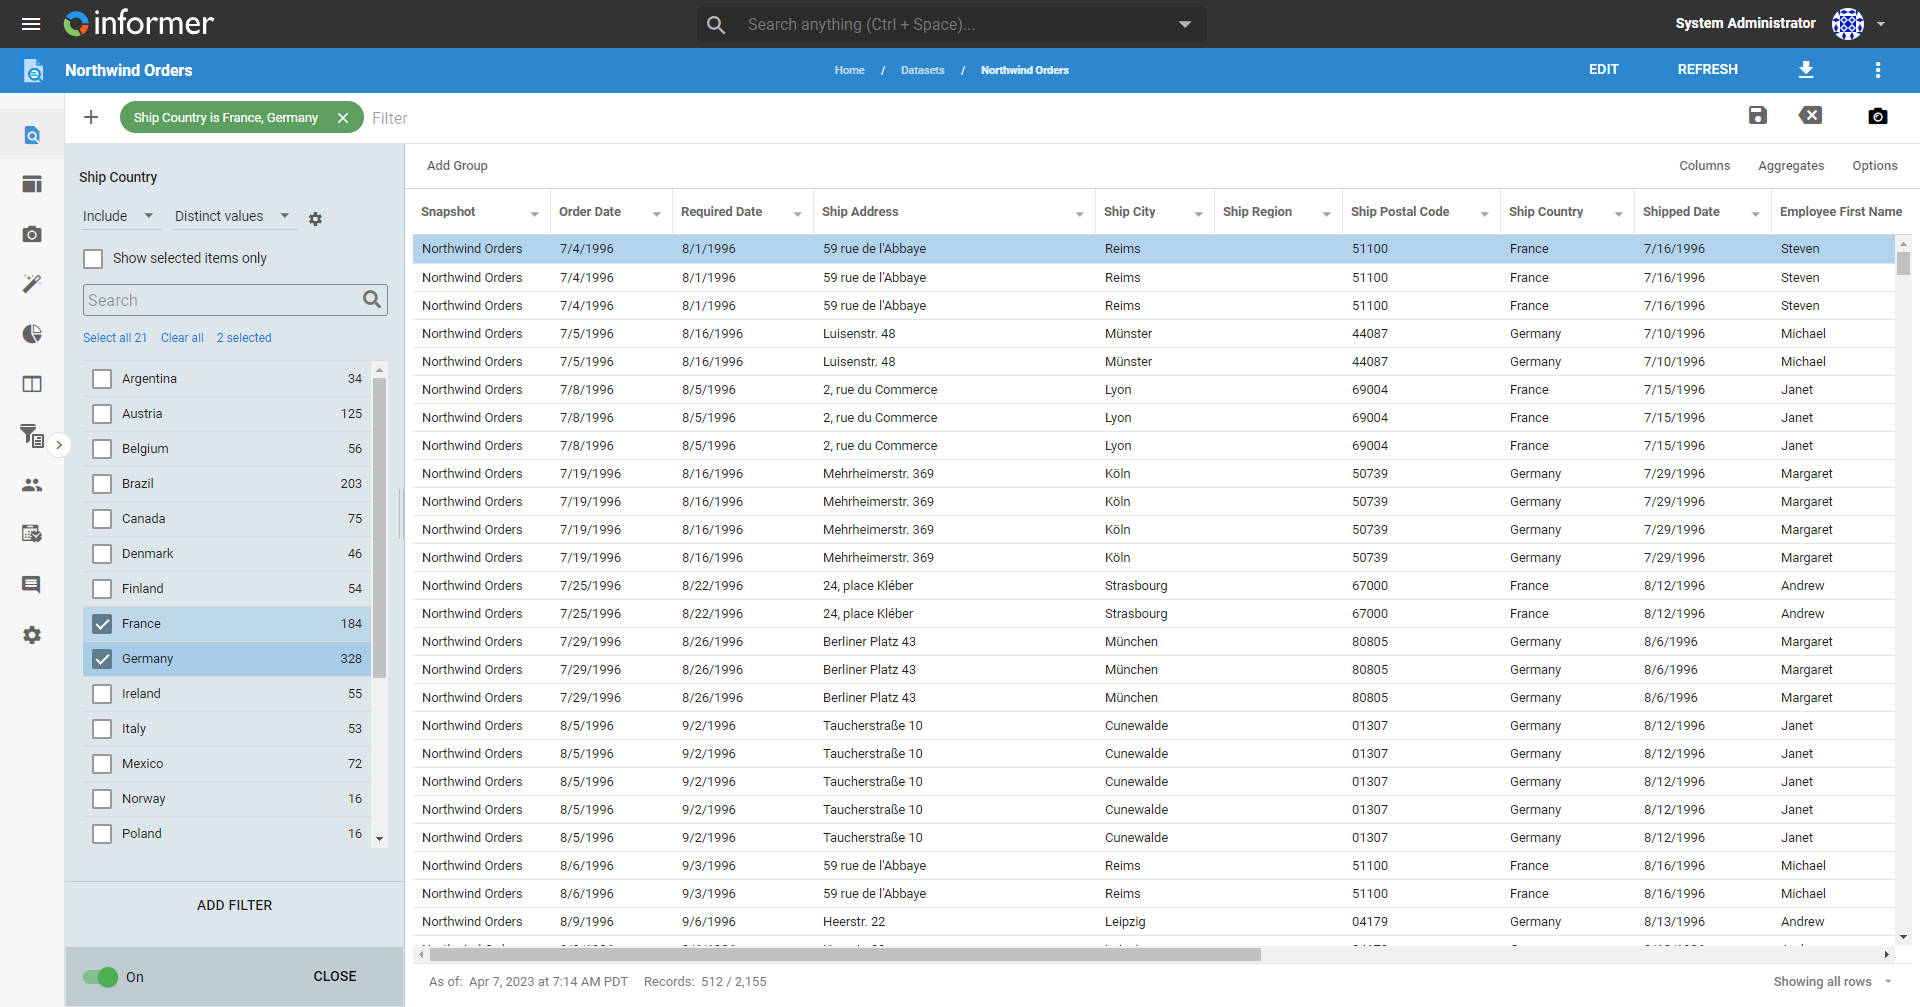
Returns a subset of the Query results constrained by the selected Filter. For more, see Creating a simple Filter.
Pin Column
Pins the Field to the left or right side of the table, keeping it in place while you scroll. To unpin, select No pin under the Pin submenu, or drag the Field header away from its pinned side.
Sort
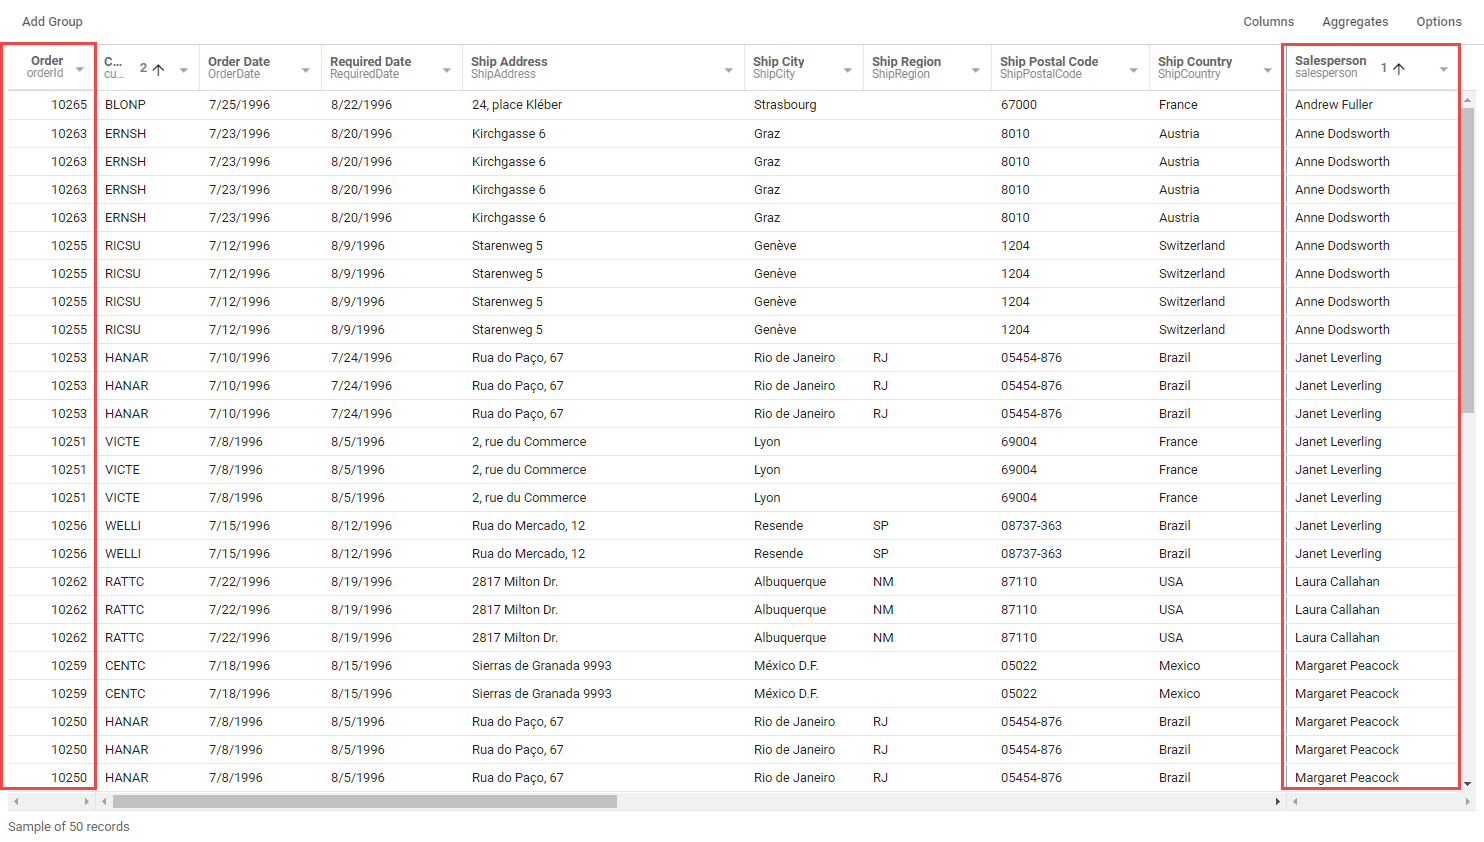
Adds or removes sorting on the selected Field, ascending or descending. Clicking the header once sorts ascending, twice descending, and a third time removes the sort. You can sort by multiple Fields at once: a configured sort shows a number in the header denoting the order. You can also hold Shift and click a header to add another sort.
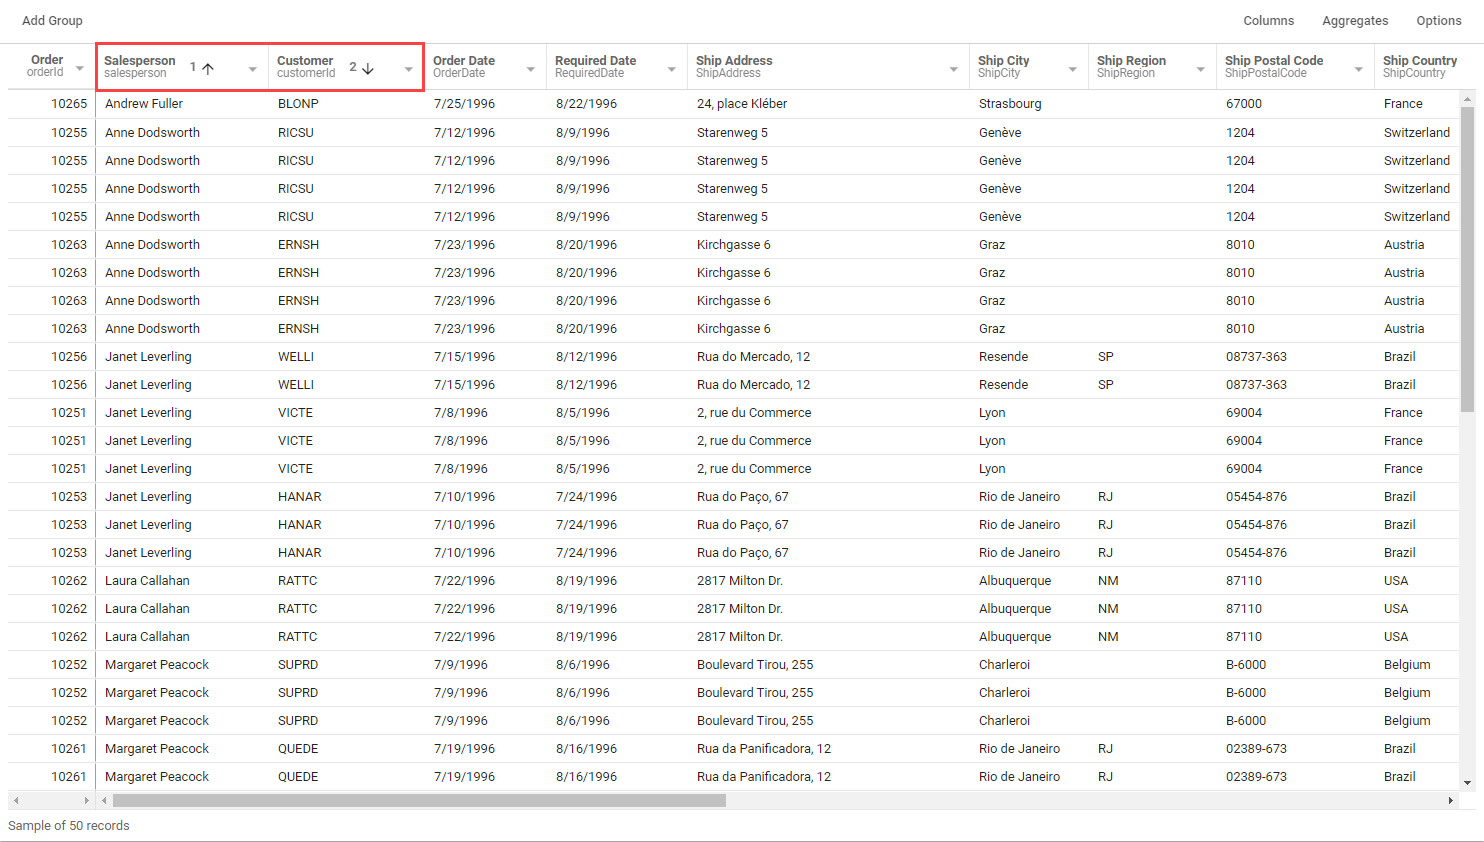
Move
Moves a Field to the beginning (far left), to the end (far right), or after a specific Field. You can also drag the Field header left or right.
Hide and Unhide
Hide hides a Field from view and excludes it from exported files. Unhide makes a hidden Field fully visible again and includes it in exports.
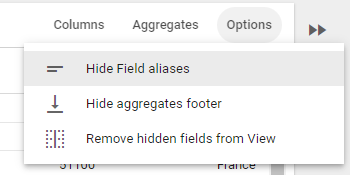
To reveal hidden Fields, click Options in the settings bar and select Reveal hidden fields; they appear grayed out and italicized. To remove them from view, select Remove hidden fields from view.
Unselect
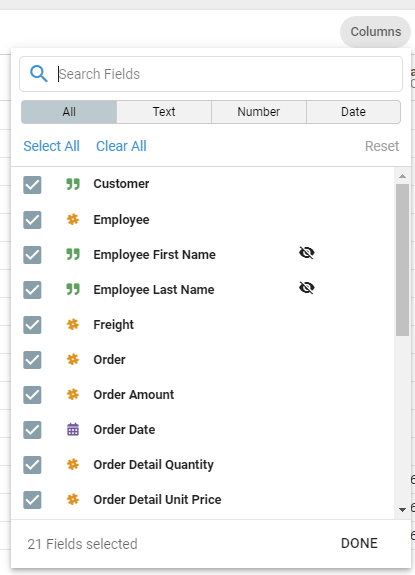
Unselect removes a Field from the grid without removing it from the entire Query, effectively the same as hiding it. To add it back, click the Columns button in the settings bar, find the Field, and check it on. The column selector lists all the columns in the Query, filterable by data type, including those removed or hidden.
Group
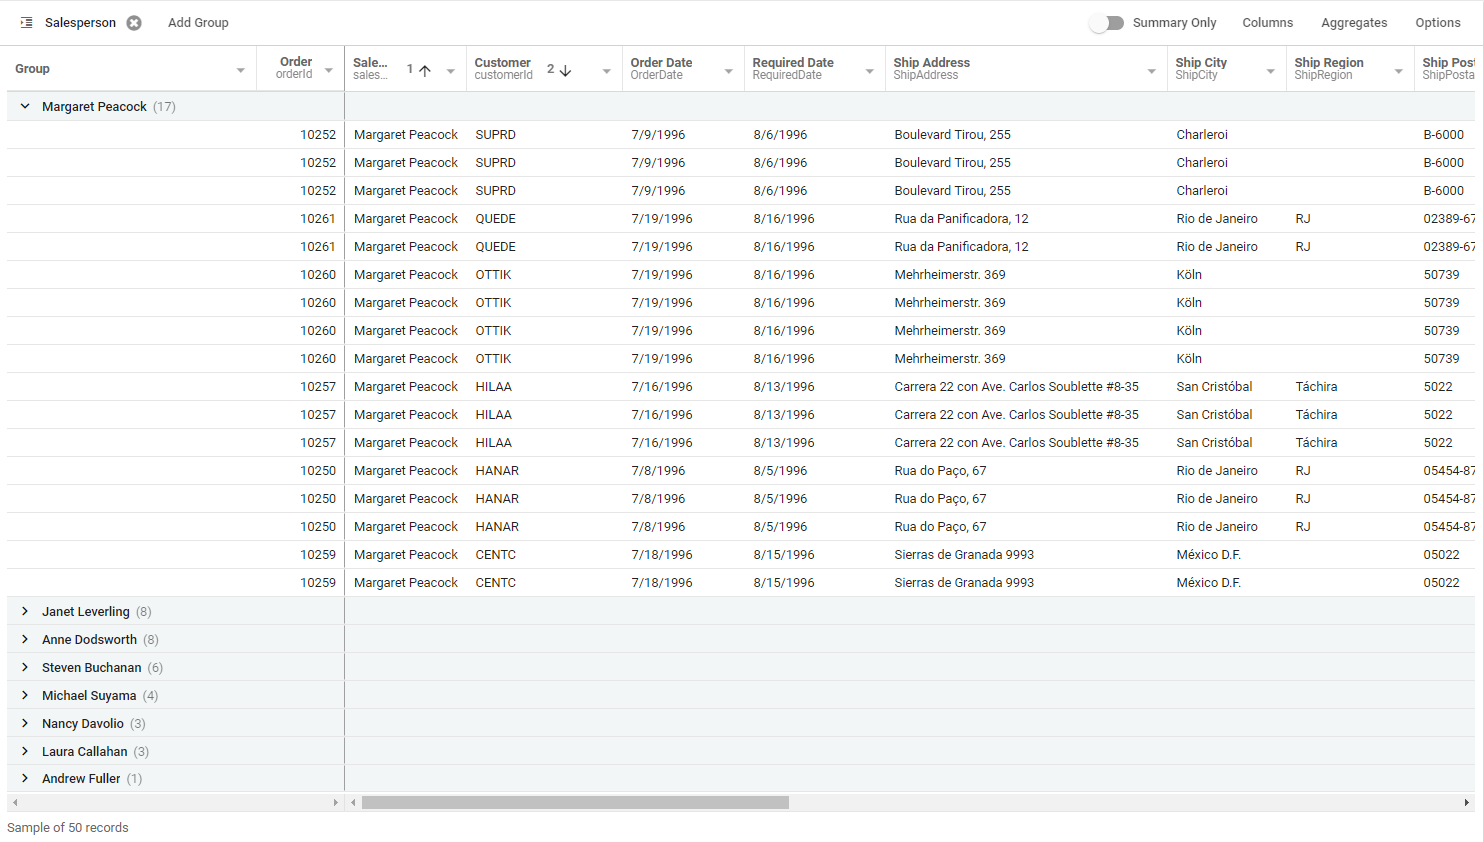
Groups data into separate tables based on the distinct values of the selected Field. Add nested groupings by clicking Add Group in the grid settings bar and selecting the next Field to group by. Remove a group by selecting Remove group from the Field's options, or by clicking the x next to the group.
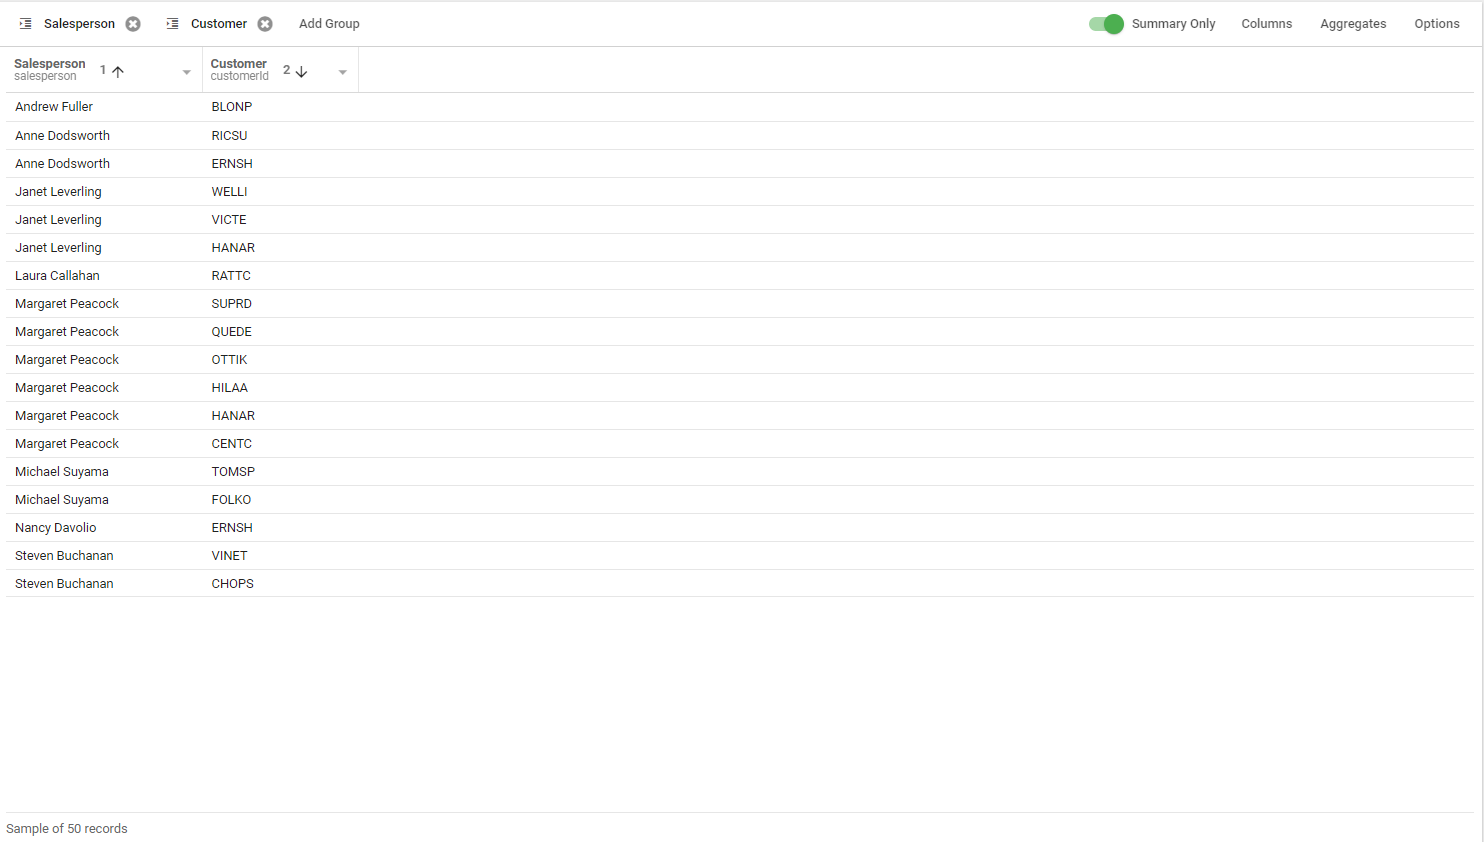
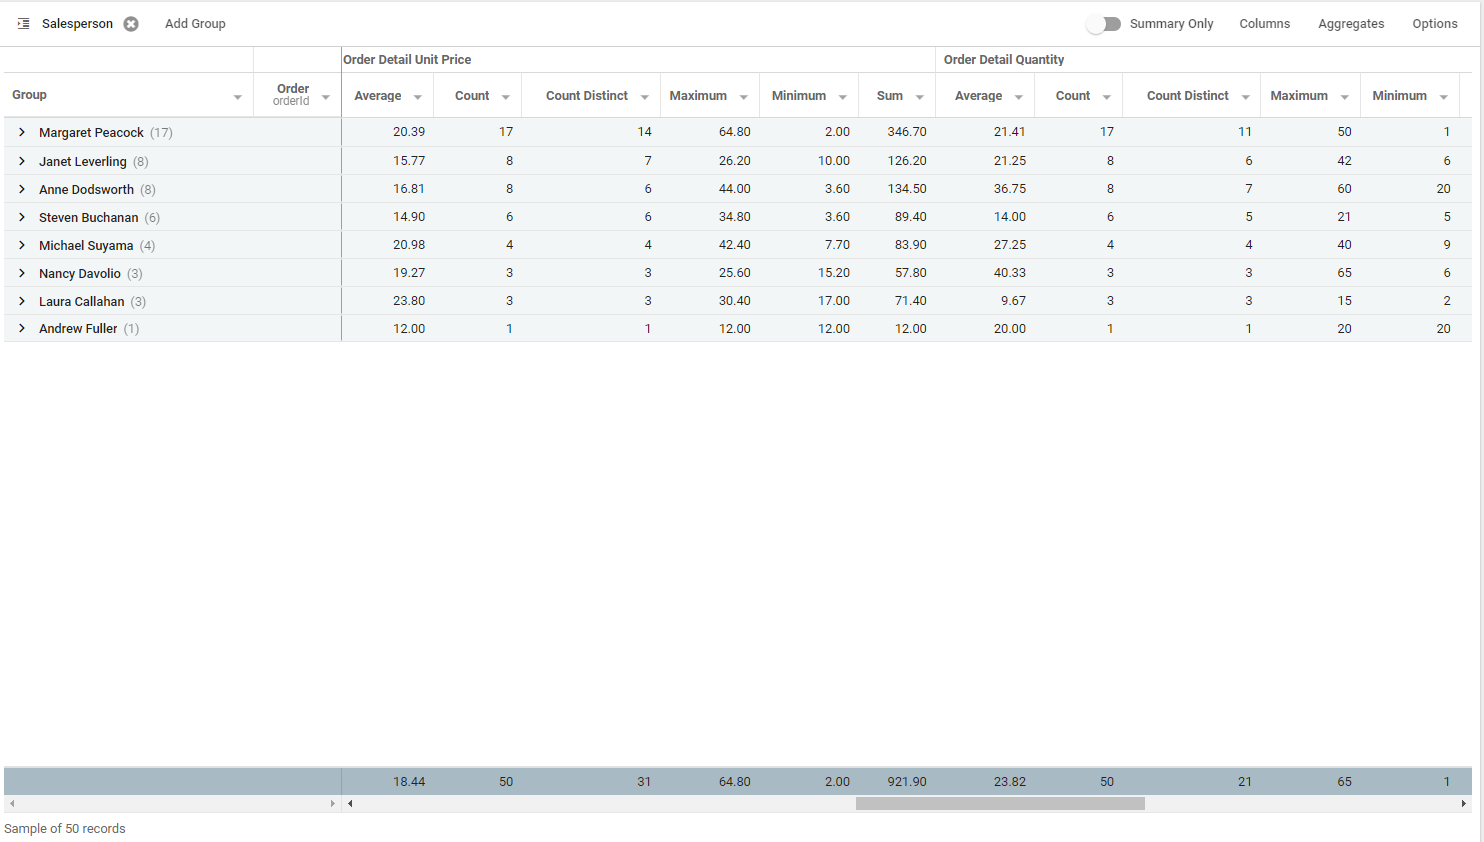
When data displays in a group, you can see an overall summary without the details. Click Summary only to display the aggregate values for each group, with a grand total at the bottom. Summary only is available on the Query edit page, the Query results page, and in Jobs.
Aggregates
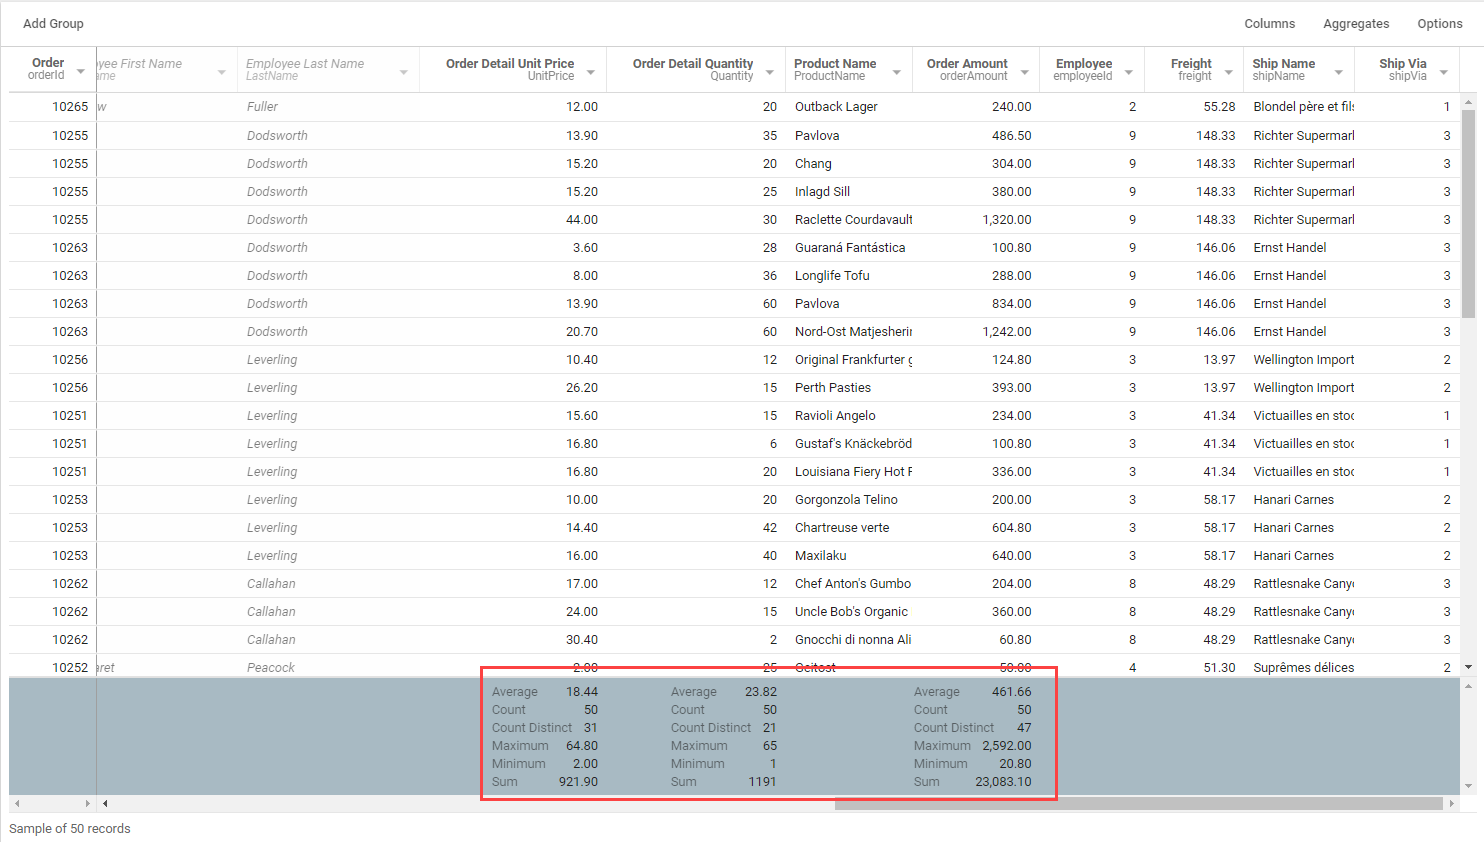
Displays aggregate values below the selected Field. The options depend on the Field's data type, and the values appear in the aggregate footer at the bottom of the result set.
When both groupings and aggregations are enabled, the grouping summaries show the aggregate values for each unique grouping, with an overall aggregate footer at the bottom.
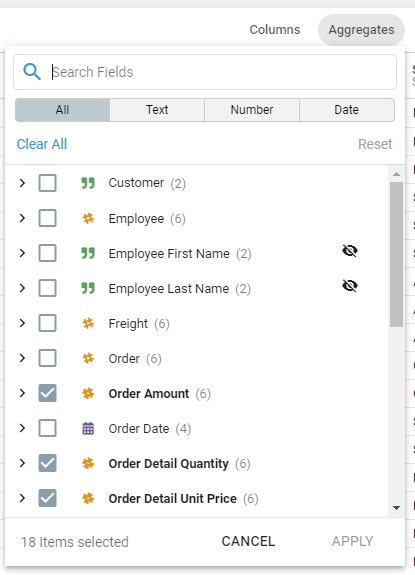
The Aggregates button in the settings bar manages all the aggregations for the grid. This selector lists every column, filterable by data type. Check a Field's box to turn on all its aggregations, or expand a Field to choose specific aggregations.
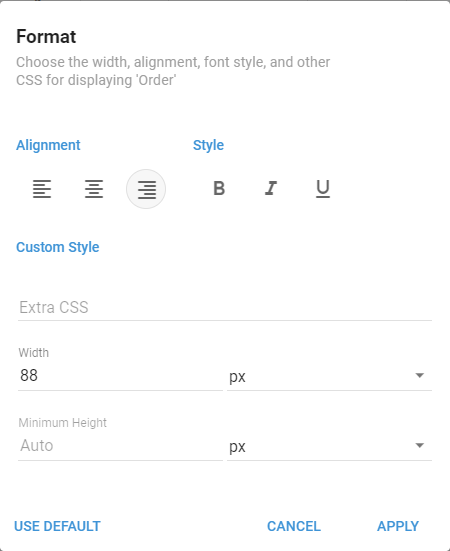
Format
Sets the alignment, style, column width, and CSS formatting.
Conditional Formatting
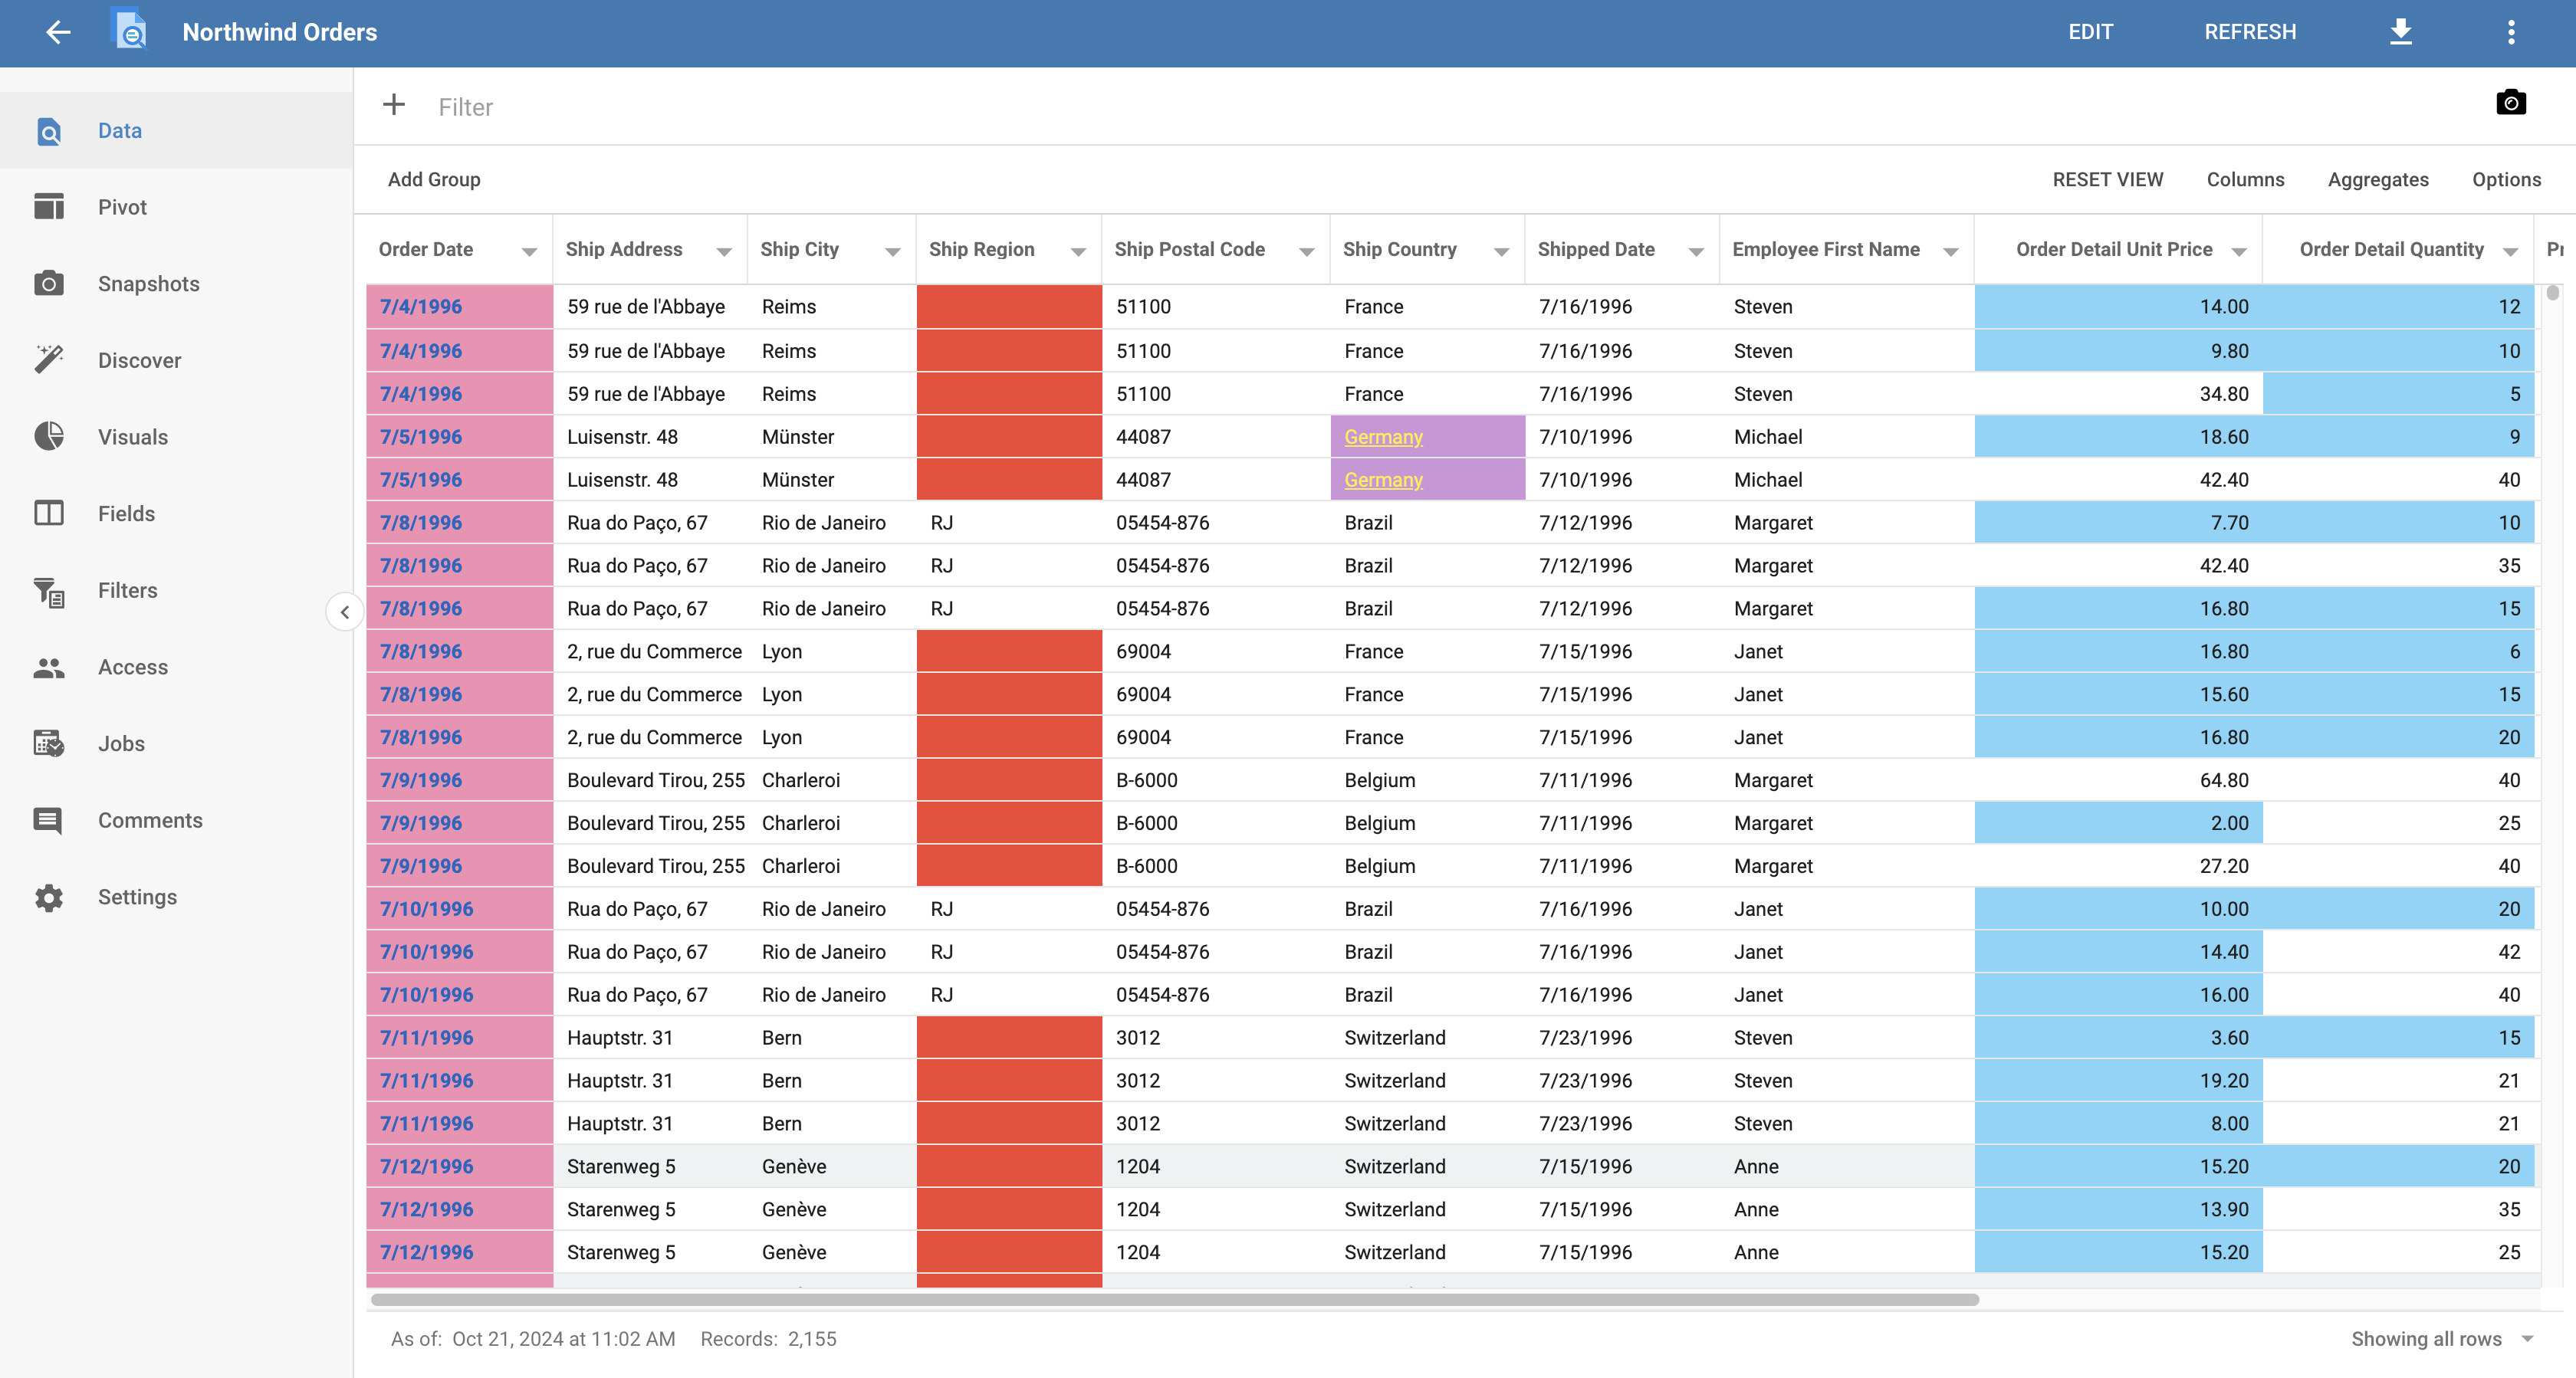
Sets the background color, text color, and text styles of data values in the grid based on conditions you set.
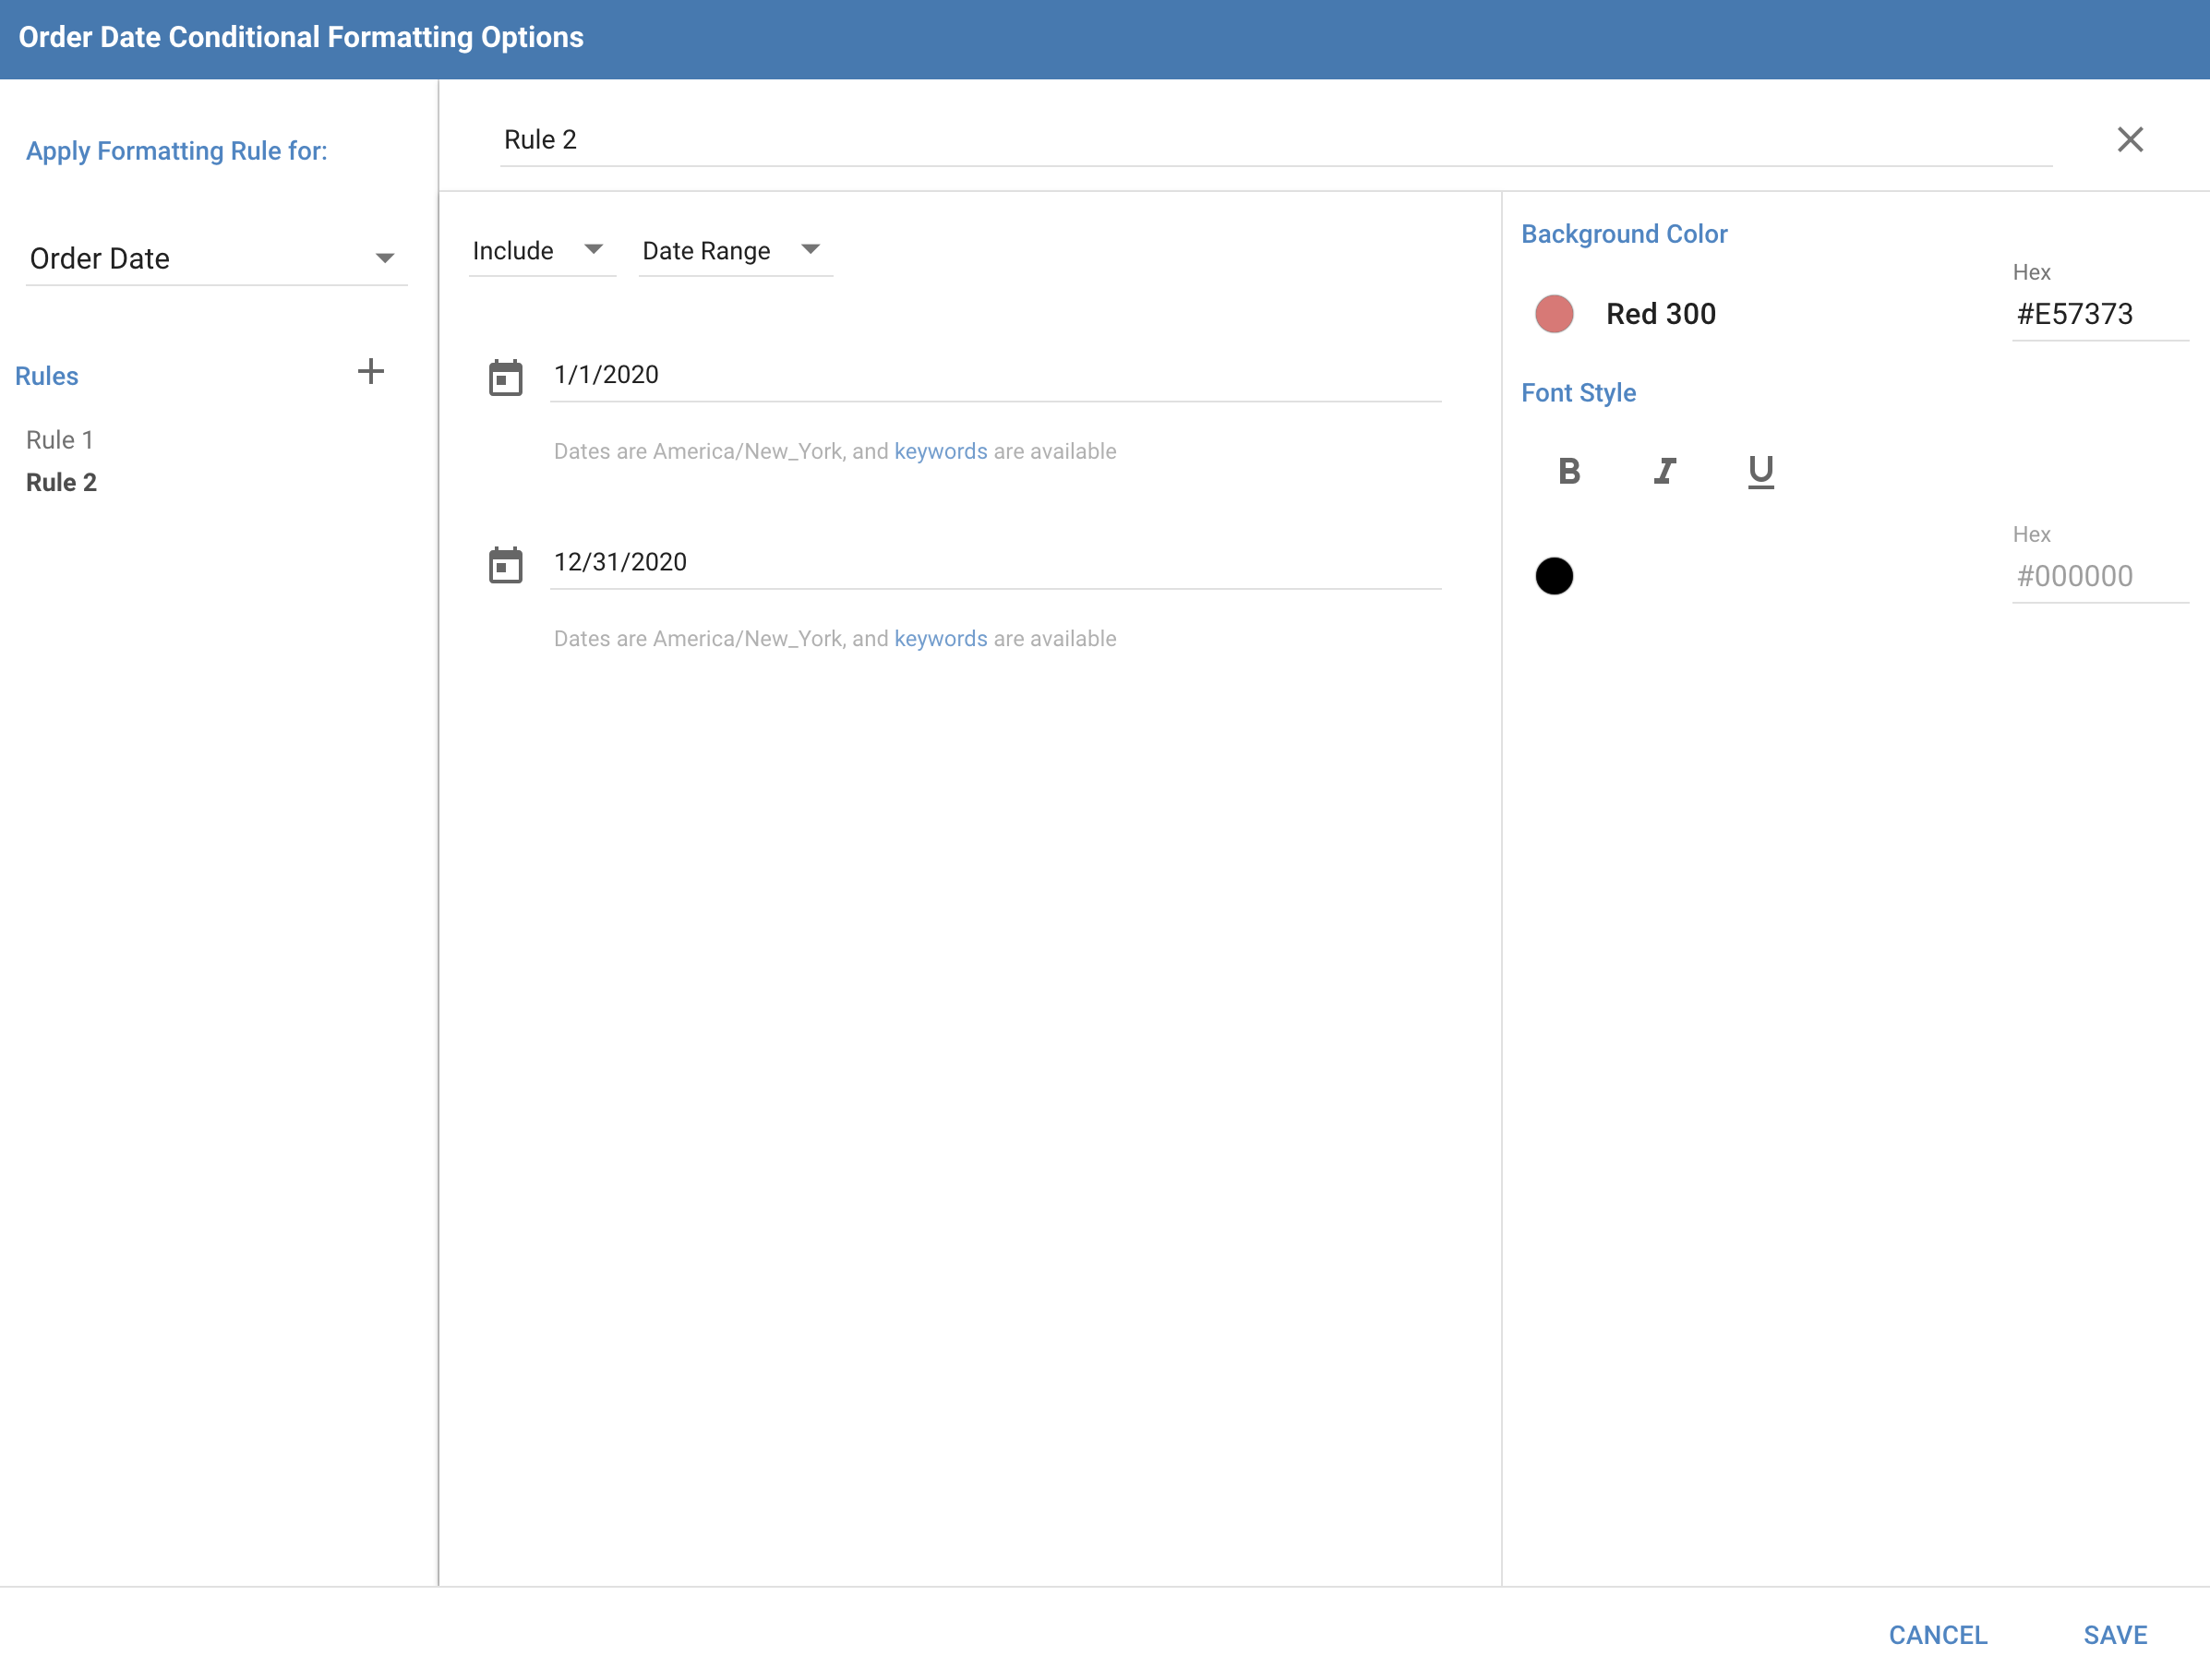
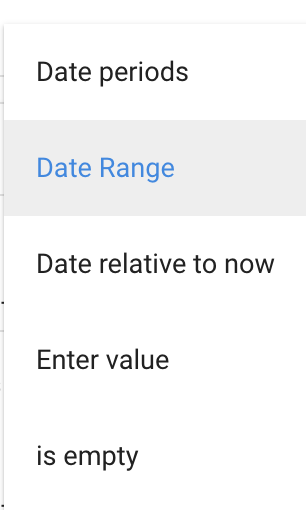
Formatting rules can apply to single Fields or the entire grid. You can add more than one rule, and rules apply to data values in the order they appear in the Rules list, which you can rearrange by dragging. Many of the configuration options are the same ones available when adding Filters.
This feature highlights important trends, patterns, or anomalies, making complex data easier to interpret. By tailoring the appearance of data to specific conditions, you can quickly identify key insights.
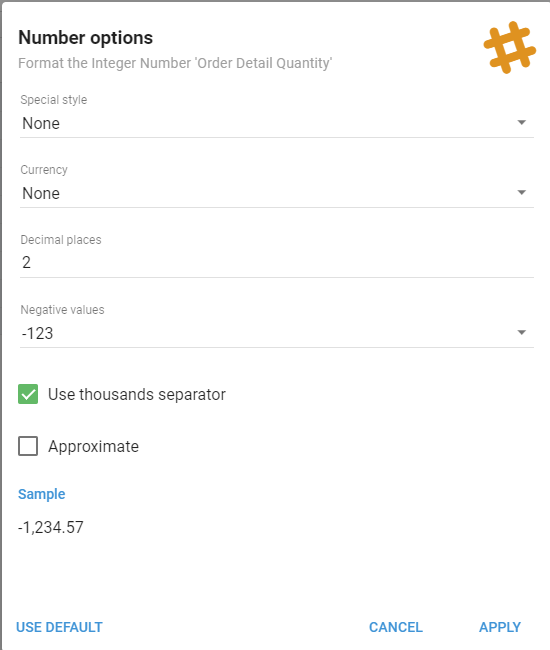
Number Options
Changes the formatting of numbers based on what the values represent. These options are only available for Integer and Decimal Number Fields.
Date and Time Format
Changes the formatting of dates or times in a column. Choose from common formats or create a custom format using moment.js formatting. These options are only available for Date and Time Fields.
Grid Settings
Unlike the standard Field options that affect a single column, these options change the appearance of the entire table.
Column width
Autosize all columns adjusts every column's width to prevent truncating headers or cell values; Autosize this column does the same for the selected column. Lock column width prevents the selected column's width from changing.
Show Field alias
Shows the alias of the Field under its label. If aliases are already shown, this changes to Hide field alias.
Hide Aggregates Footer
Available from the Options button in the settings bar, this hides the aggregate-values row at the bottom of the grid. If already hidden, it changes to Show aggregates footer.
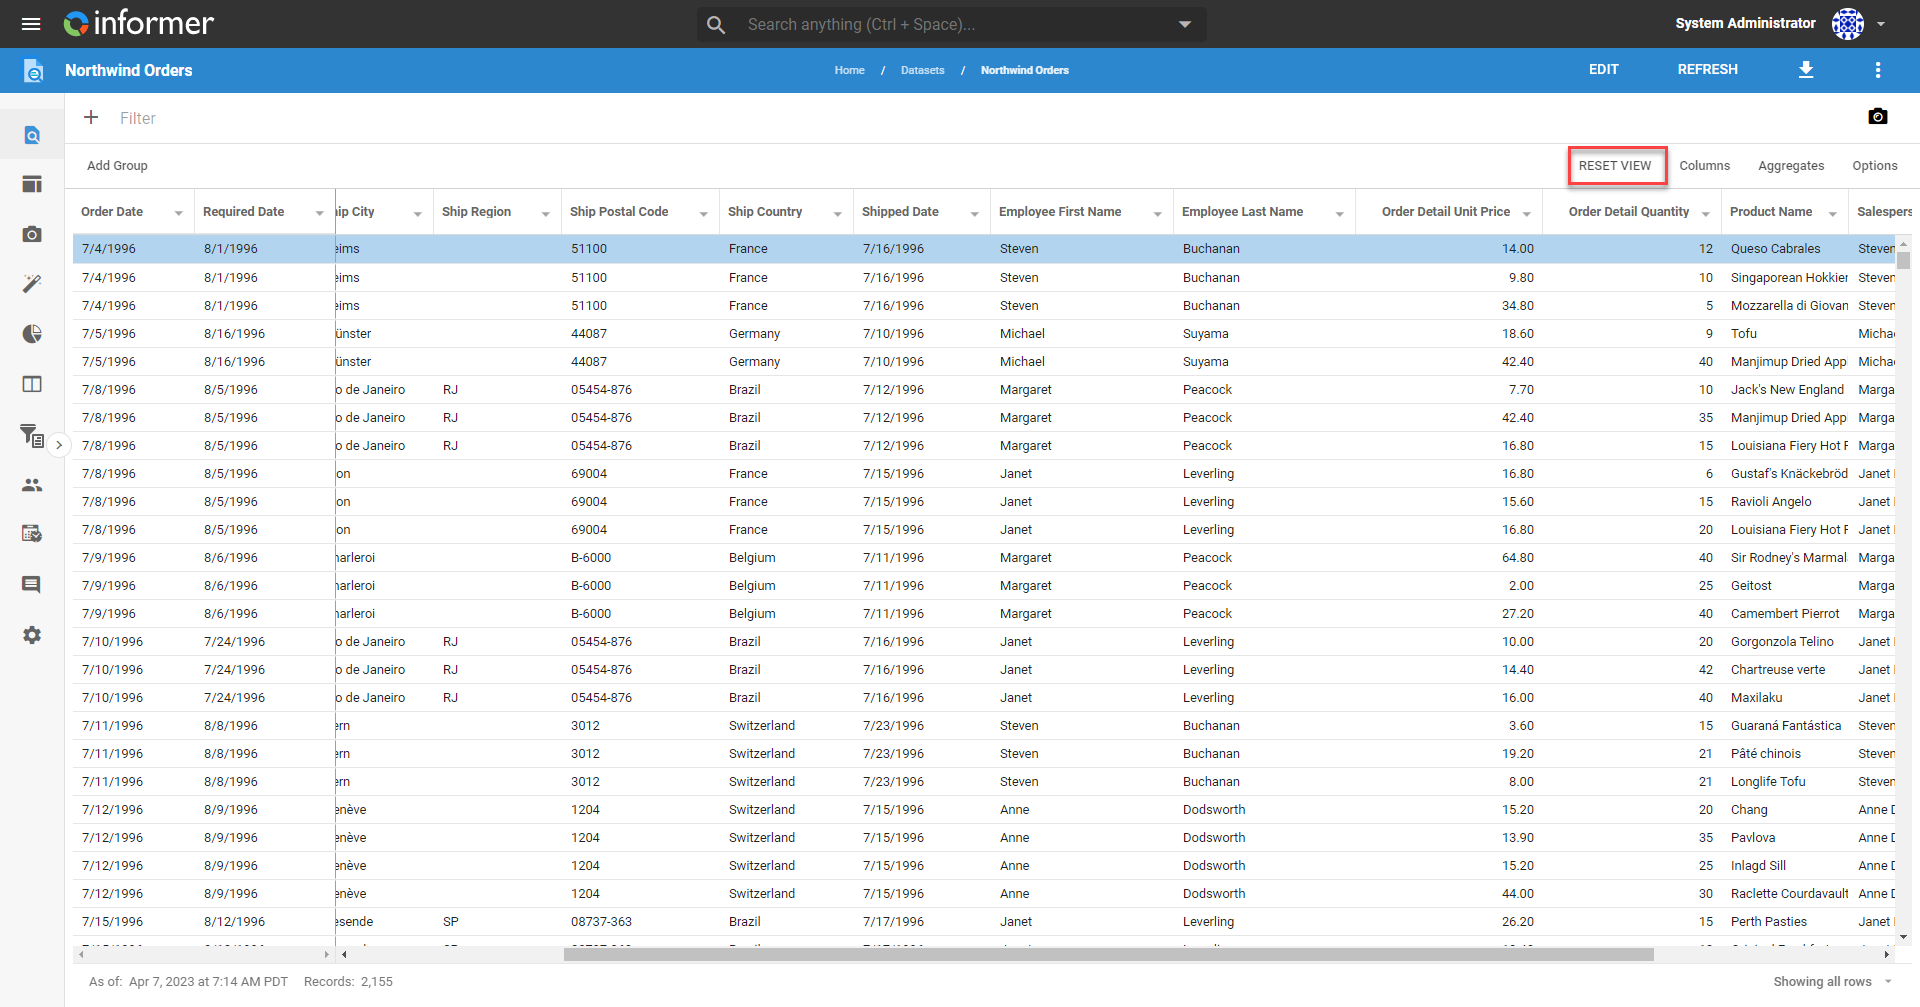
Reset View
After applying any of these settings while viewing a Query or Dataset, a Reset View option appears at the top of the grid. Clicking it resets the view to the original view of the underlying data.