Custom Aggregates
Informer uses aggregate keywords to interpret large Datasets in Reports. These functions calculate a value based on the input, which Informer uses in Visuals to display information.
Adding a custom aggregate
Enter an aggregate keyword while editing or configuring a Visual:
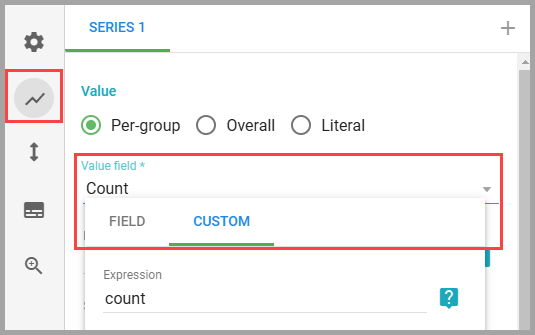
- In the edit window of a Visual, open the Series menu.
- Open the Value Field dropdown.
- Click the Custom tab.
- Enter the aggregate function into the Expression field.
Aggregate functions
Select the function based on the desired output and enter the correct syntax.
- Sum:
sum:<field>. Calculates the total value of a numeric Field across all records. For example,sum:salesAmountfinds the total sales amount. - Average:
avg:<field>. Finds the mean value of a Field, useful for understanding the central tendency. For example,avg:orderValuefinds the average order value. - Minimum:
min:<field>. Finds the smallest value in a Dataset. Works on numeric and date Fields, somin:orderDateidentifies the earliest order date. - Maximum:
max:<field>. Finds the largest value, across various data types. For example,max:shippedDatefinds the latest shipping date. - Value Count:
value_count:<field>. Counts the number of non-null entries for a Field, useful for understanding the volume of data. For example,value_count:orderIdcounts the number of orders. - Cardinality:
cardinality:<field>. Counts the number of distinct non-null values for a Field, useful for understanding the diversity of data. For example,cardinality:customerIdcounts the number of unique customers. - Count:
count. Counts the number of items in each group of aggregated data. For example,countafter grouping byshipRegioncounts the number of orders per region.
Also available through the REST API
Everything on this page is built on Informer's public REST API, the same one the product uses, so your scripts and integrations can do it too. Developer reference: Reports.